All published articles of this journal are available on ScienceDirect.

Typology of Social Network Structures and Late-Life Depression in Low- and Middle-Income Countries
Abstract
Background:
Rapid social changes and youth migration ensures a continuous drain on the social networks of the elderly in Low- and Middle-Income Countries (LMICs).
Objective:
We reviewed available literature on the relationship between social network structures and depression among community dwelling older persons in LMICs with a view to identifying patterns that might provide information for designing preventive psychosocial interventions.
Methods:
We searched the MEDLINE database through Pubmed, extracted information on the typologies of social network structures in LMICs and identified dimensions with the strongest systematic association with late-life depression, by weight, using the inverse of variance method. All analyses were conducted using the Cochrane review manager version 5.3.
Results:
Fourteen community-based surveys drawn from 16 LMIC contexts met criteria for syntheses. They included a total of 37,917 mostly female (58.8%) participants with an average age of 73.2 years. Social network size, contact with network, diversity of network, co-residency with own child, having more friends than family in the network, and prestigious standing of persons in the social network were protective structures against late-life depression. Conversely, low network diversity contributed 44.2% of the weight of all social network structures that are predictive of late-life depression.
Conclusion:
Recommendations are made for the design of new measures of social network structures in LMICs that captures the key dimensions identified. Epidemiological studies using such tools will provide more precise information for planning and prioritization of scarce resources for the prevention of late-life depression in LMICs.
1. INTRODUCTION
By 2050, approximately 80% of older persons in the world will be residents of Low and Middle Income Countries (LMICs) [1-4]; depression is the most common mental healthcondition in old age [5, 6]. Some observational studies suggest that the prevalence and incidence of late-life depression may be much higher in LMICs than those reported for high income countries [7]. Consequently, research has focused on possible preventive factors for late-life depression. In particular, the observation that late-life depression may have a strong relationship with contextual factors in the social environment of older people [8] has propelled hypotheses around the possible protective effect of good social network [9].
Social networks are the systems of social relationships in which an individual is embedded [10]. As people age and experience many losses, their social networks also narrow. This, in turn, reduces the amount of social resources available to cope with the accumulation of stressors in old age [11, 12]. In this way, persons with limited social network are likely to be at increased risk of late-life depression. In reference to another frequently cited theory [13], social network is also seen to be influenced by culture, politics and economic factors.
In terms of structure, a person’s social network may consist of people with whom they regularly interact, the characteristics of such individuals, and the quality of interactions [9]. Social networks have also functional characteristics by increasing the social support resources available to the individual [14]. Yet, the availability of a social network structure does not necessarily translate to function [15]. Therefore, the two components can be studied independently.
Many LMICs are undergoing rapid socio-economic transition [16]. Poverty, material deprivation, armed conflicts, and general insecurity are widespread [17, 18]. Health and social care is often unavailable for the majority of older people in the region [19]. Moreover, youth migration is occurring faster than ever before [20, 21]. Rapid youth migration, in particular, ensures a continuous drain on the social networks of older people through the erosion traditional of extended family systems [22, 23].
The unique socio-economic and cultural contexts of LMICs suggest that the conceptualisation of social network structures is likely to be different from those of high-income countries. Few studies have considered the typologies of social network structures and how these might relate to prevalence, onset and course of late-life depression. The objective of the present study was to review the literature on the relationship between social network structures and depression among community dwelling elderly persons in LMICs and identify the most important protective typologies.
2. METHODS
2.1. Search Strategy
We searched the Medline database through PUBMED on the 13th of May 2019 using the following keywords: ‘depression OR depressive AND Social network OR Networks OR Networking’. Searches were limited to English language literature and those based on human samples who were aged 60 years or older.
2.2. Inclusion Criteria
Studies were included if; 1) participants were drawn from a country grouped as belonging to LMICs in the World Health Organization and World Bank income categories [24], 2) they investigated epidemiological phenomena such as prevalence, incidence, risk or associated factors, and outcome, 3) they were conducted among community-dwelling participants, and 4) they used epidemiological or experimental study designs, such as descriptive and analytical cross-sectional studies, prospective and retrospective cohort studies, case control studies, randomized controlled trials, non-randomized controlled trials, quasi-experimental, as well as before and after studies.
For the purpose of inclusion, social network structure was defined as the organization (rather than its functions) of an older person’s social network [14]. This may include, but not limited to, a). The number of people with whom the older person regularly interacts, b). The characteristics of such individuals, c). Their relationships with the older person, and d). the quality of the interactions.
2.3. Exclusion Criteria
We excluded the following types of studies, 1) those conducted in hospitals, rehabilitation settings, nursing homes or other such institutions, 2) review papers, case series, individual case reports, expert opinions, discussion papers, and position papers; and 3) studies focusing solely on qualitative data. Study assessment for inclusion and exclusion criteria as well as subsequent data extraction was conducted based on the descriptions in the original article.
2.4. Statistical Methods
Flexible random effect meta-analyses were conducted to investigate the most important social network typologies that are protective or predictive of late-life depression. For these analyses, we included only studies reporting statistically significant effects at below 5% alpha. We then entered the log of study effect sizes as well as their corresponding Standard Errors (S.E) into the meta-analytic models. Estimates of effect sizes and S.Es were derived from data in the original article using methodologies developed by the Cochrane collaboration [25]. Weighting was applied using the inverse of variance method.
To determine the extent of statistical heterogeneity, we estimated the percentage of total variation in estimates reported across studies that is due to heterogeneity, rather than chance. This was computed using the I2 test. All analyses were conducted using the Cochrane review manager (Revman) version 5.3 software [26].
3. RESULTS
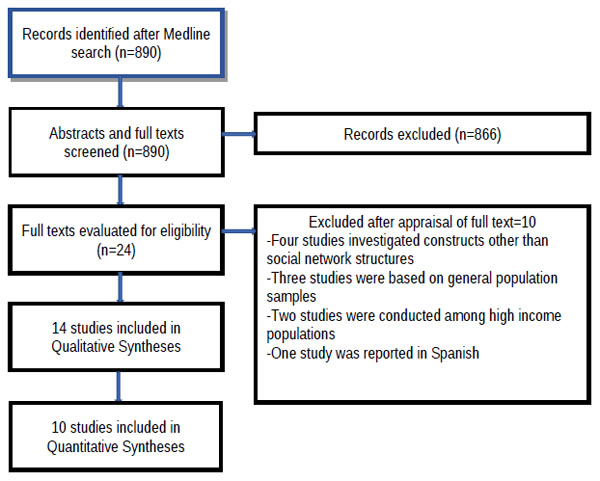
The combined database searches identified a total of 890 records. From an initial screening of the titles and abstracts of these records, we identified 24 articles that might have contained information relevant to the review. After retrieving and reading through the full texts of all 24 articles, a further 10 articles were excluded for reasons presented in Fig. (1): four studies [2, 27-29] investigated constructs other than social network structures, three studies [3, 4, 30] were based on general, rather than elderly, population samples (and did not present results specific to older participants in their samples), two studies [31, 32] were conducted among high income populations, and one study [33] was reported in Spanish.
3.1. Appraisal of Studies Meeting Inclusion Criteria
In all, 14 studies met criteria for syntheses. The studies were drawn from across 16 LMIC contexts. They included a total of 37,917 mostly female (58.8%) participants with an average age of 73.2 years (Table 1).
| References | Low- and Middle-Income Countries | Female % | Average ages, Years |
|---|---|---|---|
| Aung et al. 2016 | Thailand | 54.9 | 83.0 |
| Singh et al. 2016 | India | 53.0 | 65.0 |
| Kim et al. 2015 | Vietnam, Lao and Cambodia | 49.3 | 67.0 |
| Wahlin et al. 2015 | Bangladesh | 55.0 | 69.6 |
| Chen et al. 2016 | China | 43.5 | 80.2 |
| Monserud et al. 2015 | Mexico | 53.6 | ≥50a |
| Gureje et al. 2011 | Nigeria | 40.4 | 72.4 |
| Webster 2014 | Lebanon | 52 | 70.4 |
| Cao, et al. 2015 | China | 62.8 | 60-94b |
| Thiyagarajan et al. 2014 | India, China, Cuba, Dominican Republic, Venezuela, Mexico, Peru and Puerto Rico | 58.9 | 74 |
| Caetano et al. 2013 | Brazil | 65.2 | ≥60a |
| Tong et al. 2011 | China | 72.4 | 79.1 |
| Chan et al. 2009 | China | 100 | 71 |
| Siccote et al. 2008 | Cuba | 62.8 | ≥60a |
Key information about the studies is presented in Table 2. They were published between April 2008 and August 2016. About 30% of included studies were from China. Twelve (85.7%) had a cross-sectional design. The remaining two studies were prospective observations of between two- [34] and three-years [7] follow-up. Only three studies used standardised clinical interviews for the ascertainment of depression [7, 34, 35]. The remaining 78.6% relied on various rating scales.
| Community Based Cross-Sectional Surveys | ||||||
| References | Sample Size | Social Network Typology | Outcome Measure | Measure of Effect | Effect Size (95% C.I)a /Standard Errors | Effect (YES/NO) |
| Aung et al. 2016 | 435 | Size (Social Network Index) |
30-item GDSb | Beta/Linear regression | Larger size, -0.18 (-0.28, -0.09) |
Protective |
| Singh et al. 2016 | 630 | Composition: children, relatives, friends, confidant networks |
WHOc Composite International Diagnostic Interview | O.Rd/Logistic regression | Children, 1.32 (0.79–2.21) Friends, 0.33 (0.18–0.61) Relatives, 0.70 (0.39–1.27) Confidant, 0.549 (0.17–1.75) |
Protective if composed of friends |
| Chen et al. 2016 | 400 | Composition: family, relatives, friends, health care networks |
15-Item GDSb | Beta/Linear regression | Family, -0.46/0.43 Friends, -1.1/0.55 Health and social carers, 1.17/0.51 |
Protective if friends, Predictive if carers |
| Kim et al. 2015 | 147 | Interaction (Lubben’s Scale) |
15-item GDSb | Beta/linear regression | Greater connectedness, -0.02/0.28 |
NO |
| Caetano et al. 2013 | 3649 | Interaction: Reciprocal visits |
Self-report of clinician diagnoses | O.Rd/Logistic regression | No visits, 1.38 (0.83 – 2.29) |
NO |
| Tong et al. 2011 | 228 | Interaction: Meetings/telephone |
15-Item GDSb | Beta/Linear regression | Telephone, −.083/8.30 Meeting with someone, −.027/2.7 |
NO |
| Wahlin et al. 2015 | 471 | Interaction: Satisfaction with contact |
Self Reporting Questionnaire | Prevalence rate ratio | Fully satisfied with contact, 0.61 (0.46–0.80) |
Protective |
| Sicotte et al. 2008 | 1905 | Geographical Proximity: Co-resident with children or not |
15-Item GDSb | O.R/Logistic regression |
Co-resident children Women, 0.43, (0.25–0.74) Men, 0.29, (0.07–1.16) Non co-resident children Women, 0.70, (0.44–1.11) Men, 0.94, (0.40–2.20) |
Protective in women with co-resident child |
| Wahlin et al. 2015 | 471 | Geographical proximity: Co-residency | Self Reporting Questionnaire | Prevalence rate ratio | Co-resident child, 0.78 (0.66–0.94) No co-resident children, 1.28 (1.02–1.60) |
Protective: co-resident Predictive: if not. |
| Monserud et al. 2015 | 8704 | Geographical proximity: Co-residency with own children/other relative/friends/network lives in the neighborhood |
Modified CES-De 20 | Beta/linear regression | Co-resident children, 0.18/0.21, Co-resident other relatives, 0.31/0.17, Children nearby, 0.05/ 0.10, Relatives nearby, -0.14/0.10, Friends nearby, -0.04/ 0.11 |
Predictive if co-resident with other relatives (i.e., Other than their own children) |
| Webster 2014 | 195 | Geographical proximity: Network lives far away |
CES-De 11 | Beta/linear regression | Distant family, 0.43/2.24, |
NO |
| Webster 2014 | 195 | Emotional proximity: Hierarchical mapping |
CES-De 11 | Beta/linear regression | Distant family, 2.57/1.78, Close family, −2.31/1.61 |
NO |
| Cao, et al. 2015 | 928 | Social standing: Occupational Prestige Scale |
30-Item GDSb | Beta/linear regression | Prestigious, -0.07/0.34 |
Protective |
| Thiyagarajan, et al. 2014 | 17,031 | Diversity: PANTf assessment |
Geriatric Mental State Examination | Prevalence ratio | Low diversity, 1.20 (1.08 – 1.34) |
Predictive |
| Sicotte et al. 2008 | 1905 | Diversity: Types of relationship |
15-Item GDSb | O.R/Logistic regression | High diversity Women,0.34, (0.17–0.69) Men,0.14, (0.04–0.48) |
Protective |
| Chan et al. 2009 | 1042 | Social Network Scale (aggregate scores) | 15-Item GDSb | O.R/Logistic regression | Lower social network scores, 3.63, (2.35–5.60) |
Predictive |
| COMMUNITY BASED OBSERVATIONAL STUDIES | ||||||
| Monserud et al. 2015 | 8704 | Geographical proximity | Modified CES-De 20 | Beta/linear regression | Co-resident children, 0.20/0.23, Co-resident others, -0.31/0.18, Children nearby, -0.01/0.14, Relatives nearby, 0.25/0.13, Friends nearby, 0.24/0.13 |
Symptomatic improvement if co-resident with other relatives |
| Gureje et al. 2011 | 2149 | Interaction (frequency of contacts) |
WHOc Composite International Diagnostic Interview | Hazard ratios/Cox regression |
No Family contacts women, 2.4, (0.3–20.3) men, 2.5, (0.4–16.0) No friends contact Women, 2.1 (1.1–3.7) Men, 1.5 (0.7–3.4) |
Predictive of onset in women with no friends contact |
Included studies clearly described the source population and sampling frame. Appropriate analytical techniques were used. Half of the studies derived beta values for the association between social network structures and late-life depression. The remaining studies derived other valid measures of study effect (Table 2). The corresponding S.E or 95% Confidence Intervals of the reported effect sizes were also presented.
3.2. Ascertainment of Social Network Structures
In Table 2, various standardised questionnaires and rating scales were used to ascertain types of social network structures. Apart from an aggregate score on the Lubben’s Social Network Scale [36], six broad typologies of social network structures were investigated across studies. These include:
- Social network size, defined in Aung et al. [37] as the number of persons in the social network. This was assessed using the Cohen’s index [38].
- Social network composition, defined in Singh et al. [39] as comprising either children network, relatives’ network, friends’ network or confidant network. The same construct was classified in Chen et al. [40] as either having family, relatives, friends or health/social care workers in the network.
- Social network interaction, This was defined using the Lubben’s Social Network Scale [36] in Kim et al. [41]. It was also described as the frequency of reciprocal visits between the older persons and other people in their network [42]. Further, the interaction construct was defined in other studies as having a meeting with someone in the network [43], telephone conversation [43], satisfaction with contact [44] or regularity of contact [7].
- Geographical proximity, This was defined by co-residency with own children (whether biological or foster) or not [34, 44, 45]. Co-residency with other family members rather than own children was an additional definition of proximity provided in Monserud and Wong [34]. For non-co-resident respondents, geographical proximity was further expounded by whether respondents had adult children who lived in the same neighborhood [34], or lived more than half an hour from the older person [46]. The emotional proximity of social network was a supplementary category of geographical proximity defined in Webster et al. [46] as the relative distance between the older persons and people in their network.
- Social network diversity, Summarised in Thiyagarajan et al. [35] as integrated on non-integrated networks based on results of the Practical Assessment of Network Types [47]. Diversity was also defined in Sicotte et al. [45] by the number of different types of relationships the older person had with people in their network.
- Social standing of the network, defined in Cao et al. [48] as the older person’s connection with family members, friends or acquaintances in a list of 20 specific occupations with varying prestige scores. To achieve this, a position generator procedure was applied to occupational prestige scale scores [49].
3.3. Association of Types of Social Network Structures with Late-life Depression
In Table 2, social network interaction was the most cited broad typology of social network structures. The construct was investigated in five studies [7, 41-44]. However, three of the five studies of social network interaction showed no statistical effect on depression. Also notable in Table 2 are the results of two longitudinal observations in relation to social network interaction [7] and geographical proximity [34].
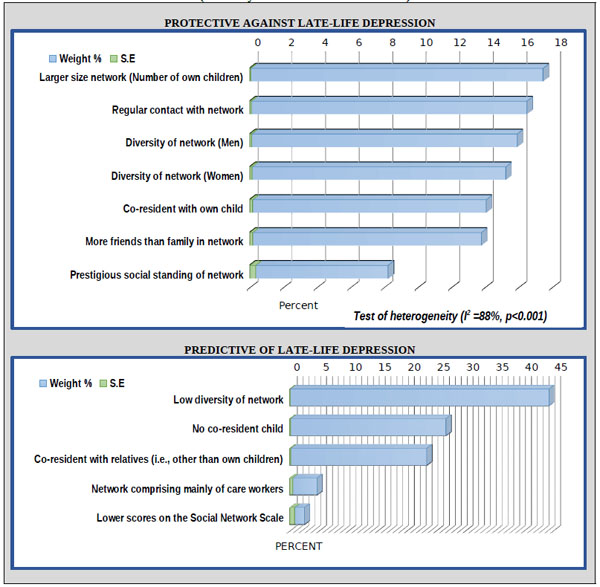
The disaggregated factors in the dimensions of social network structures demonstrating systematic association with late life depression are presented in Fig. (2). In the decreasing order, the most precise protective factors were large network size, regular contact with network, high network diversity, having a co-resident child, having more friends than family in the network, and prestigious standing of persons in the social network. However, large network size and regular contact with network contributed more than one-third (33.8%) of all systematic associations with late life depression. Conversely, 44.2% of all predictive factors for late-life depression was contributed by low network diversity.
4. DISCUSSION
The present study found that six broad dimensions of social network structures demonstrate significant protective effects against late-life depression in LMICs. In descending order of weight contributed, the dimensions were represented by social network size, contact with network, diversity of network, co-residency with own child, having more friends than family in the network, and prestigious standing of persons in the social network. However, large network size and regular contact with network contributed more than one-third (33.8%) of all protective structures against late life depression. Conversely, 44.2% of all social network structures that are predictive of late-life depression was contributed by low network diversity.
The finding that prestigious standing of persons in the network contributed much less (7.9%) to the pooled weight of protective structures against late-life depression may be due to the complex nature of the position generator procedure [50]. The social standing index generated by this procedure is an aggregate score comprising the number of occupations endorsed by respondents, the highest prestige score of occupations so endorsed and the range of prestige scores. Each of these components have been found to have their own unique effects on wellbeing [51]. For example, while the endorsement of higher number of occupations demonstrate strong relationship with health, prestige scores assigned to those occupations may sometimes show non-significant effects [52]. Another possible reason for an observed small effect of social standing on late-life depression is the observation that social stratifications based on occupation may be more relevant to high-income countries [53]. This is as large numbers of community-dwelling older people in LMICs engage in subsistence farming and other elementary occupations [54].
A third observation in the present review is that individual studies on the relationship between social network and late-life depression in LMICs have often selected only a few dimensions of social network structures for investigation. In this way, studies appear less comprehensive in their approach to the social network. The result of this is the observed variability in findings. Inconsistencies in the magnitude and direction of associations make it difficult to decide on the most appropriate targets for preventive interventions based on social network characteristics. Greater precision in findings will provide the information needed by policy makers to better streamline scarce resources for the prevention of late-life depression in LMICs.
It would seem that the most comprehensive assessment of the dimension of social network structures in the present review was provided by Chan et al. [55] since the authors relied on the summary score on the Lubben’s Social Network Scale [36]. Analyzing from the dimensions of social network structures identified in the present study, the Lubben’s scale demonstrates relatively superior face validity by providing some assessment of four out of the six broad dimensions identified: social network size, diversity, interaction and geographical proximity. However, the relative predictive weight of association of the Lubbens’s scale summary score with depression in the present study was low. While this finding may also suggest weaknesses in the primary study [55], it provides some evidence of inadequate known group validity of the Lubben’s social network scale.
We note that the validity and reliability of available measures of social networks have long been a source of concern in the literature [15, 56]. Future research should strive towards attaining the goal of finding the best measurement modalities for social network structures and functions in specific populations and disease contexts. The optimal tool for assessing social network structures relevant to late-life depression in LMICs may yet be unavailable. Such a tool should ideally produce measures that are easy to interpret and are comprehensive enough to assess the dimensions of social network structures identified in the present study.
The observations made in this limited review should be interpreted within limitations of the quality of available data. Judgments about the contributions of the different facets of the social network to late-life depression using meta-analytic weighting may be affected by methodological variability in the included studies. In this regard, it should be noted that a significant heterogeneity (I2=88%, p<0.001) was recorded when studies reporting significant protective effects of social network structures on late-life depression were combined. On a closer look at our data, the significant statistical heterogeneity found in studies reporting protective effects of the social network was due to the effect size outlier reported when examining the effect of the prestigious social standing of members of the network on late-life depression. The study by Cao and colleagues [48] conducted among 928 older residents in Hangzhou China was the only citation in the series to use the occupational prestige scale as a meaningful index of social network structure. Even though this study [48] contributed only 7.9% of the weight of all studies reporting significant protective effect of social network structures, its effect size is about half of the combined effect sizes reported by the other studies in the series.
The present mini review has other limitations. We have carried out a rapid review of the literature on social network structures and late-life depression in LMICs. As such, the search strategy has focused on records in the MEDLINE database. Records in other important databases, such as PsychInfo and Embase have not been considered. Also, manual searches of the reference list of included studies as well as grey literature were not implemented. Nevertheless, the MEDLINE is, perhaps, the largest repository of biomedical literature. To ensure that ahead of print articles are not missed, we implemented our search of the MEDLINE database through Pubmed.
CONCLUSION
Health care resources are limited in LMICs. As such, accurate information about the contribution of different types of social network structures that may be protective for late-life depression in these countries may be helpful in the planning and prioritization of policies and allocation of scarce resources. New measures that include the broad dimensions of social network structures identified in the present study are needed. Such new tools should be deployed in future large-scale surveys of the mental health and wellbeing of elderly persons living in LMICs. While cross-sectional surveys are important, the use of such tools in longitudinal observations will provide even more robust information about the relative contributions of social network structures and functions to the mental health of older people in LMICs.
CONSENT FOR PUBLICATION
Not applicable.
FUNDING
None.
CONFLICT OF INTEREST
The authors declare no conflict of interest, financial or otherwise.
ACKNOWLEDGEMENTS
AO performed literature search, data extraction and analyses, AO and OG wrote the first draft of the paper. Both authors approved the final draft for submission.