All published articles of this journal are available on ScienceDirect.
Acute Affective Responses and Frontal Electroencephalographic Asymmetry to Prescribed and Self-selected Exercise
Abstract
Objective:
Our goal was to compare affective responses and frontal electroencephalographic alpha asymmetry induced by prescribed exercise (PE) and self-selected exercise (SS).
Method:
Twenty active participants underwent a submaximal exercise test to estimate maximal oxygen consumption (VO2max). Participants enrolled a cross-over randomized study where each participant completed three conditions: PE (50%PVO2max), SS and Control. The electroencephalography was performed before and after exercise. The feeling scale, felt arousal scale and heart rate were recorded before, during and after each condition. The ratings of perceived exertion were recorded during and after each condition.
Results:
The heart rate and ratings of perceived exertion showed higher values in the PE and SS conditions compared to controls, with no differences between the PE and SS conditions. For the feeling scale, the SS presented higher values compared to the PE and Control conditions. The felt arousal scale presented higher values in the PE and SS conditions compared to control. There was no interaction between condition and moment, or main effect for condition and moment for frontal alpha asymmetry (InF4-InF3).
Conclusion:
The SS provided better affective responses compared to PE, thus can consider self-selected intensity as an appropriate option. In general, no frontal alpha asymmetry was seen due to an exercise intervention.
INTRODUCTION
Affect is the central component of all valences, positive or negative, including emotions and mood states as well as pleasure, displeasure, stress, relaxation, fatigue, energy, among other [1]. Exercise is known to promote positive affective responses, decreasing state anger, anxiety, and tension, while increasing vigor and pleasure [2, 3]. Several factors may influence affective response during exercise (e.g. intensity and duration) [4, 5]. Previous reviews and meta-analyses showed that exercise sessions performed at low to moderate intensities are related to positive affective responses [4-6]. According to Ekkekakis and Petruzzello, exercise intensities near the ventilatory threshold may provide positive affective responses [4]. Reed and Ones reported that the intensity range to provide positive affective responses should be between 15%-39% of oxygen consumption reserve (VO2R) and the lactate threshold [5]. On the other hand, it seems that exercise sessions performed at intensities above the lactate threshold are associated with a reduction in affective responses [7].
One of the physiological measures that could explain the pattern of affective responses is electroencephalography (EEG). Specifically, the frontal electroencephalographic asymmetry measurement has been further investigated for this purpose [8-10]. This frontal asymmetry, particularly postulated within the alpha frequency band (8-12 Hz), is the main cornerstone of Davidson’s model [11]. The activity in the alpha frequency band is negatively related to the activity of the underlying cortex as increased alpha power is associated with lower cortical activity [12]. The alpha activity in the frontal regions is used to compute an asymmetry index (F4-F3) for determining activity on the left versus right frontal cortex [11].
The model proposed by Davidson et al. [11] demonstrates that negative affective responses were associated with higher activation of the right frontal cortex and positive affective responses were associated with higher activation of the left frontal cortex. It has been shown that frontal EEG asymmetry evaluated at rest before an exercise session can predict the affective responses after exercise [8, 9, 13, 14]. However, other studies found no relationship between frontal EEG asymmetry and affective responses [10, 15, 16]. The incongruent results could be explained by the effects of different intensities used in these studies [15, 16].
In the context of exercise intensity, previous studies discussed the benefits of self-selected exercise for affective responses [17-19]. The comparison of prescribed (PE) and self-selected (SS) exercise using appropriate scales to measure affective responses may contribute to these controversial results in the literature. Moreover, frontal EEG asymmetry measured at rest (pre-exercise) and after exercise can contribute to a better understanding of the possible exercise-induced effects in cortical activity which underlie psychological changes.
The objective of this study was to compare affective responses and frontal EEG asymmetry induced by PE and SS exercise sessions. The hypothesis is that the improvement of affective responses would be achieved after the SS exercise. We postulate that the SS condition would result in a right-ward asymmetry, with higher alpha power in the right prefrontal cortex in comparison to the left prefrontal cortex after exercise.
METHODS
Participants
Young healthy individuals (n = 20), right-handed, physically active for at least the last 3 months (aerobic exercise 3 times per week) and who did not have any mental, neurological, and musculoskeletal disease were recruited. Participants classified with moderate or high risk for cardiovascular disease and who were taking any medication as well as smokers were excluded from the study [20]. Participants were instructed not to drink alcohol or caffeine 24 hours prior to the tests. Each participant signed the informed consent form, and the experiment was approved by the institutional ethics committee of Gama Filho University (number 172.2011).
Procedures
The participants underwent four visits to the Exercise Neuroscience Laboratory at Gama Filho University. On the first visit participants signed a consent form, responded to the Risk Stratification questionnaire and underwent anthropometric measurements. Then resting heart rate (HRrest) was measured after six minutes in the supine position. Later, a submaximal test was performed using a cycle ergometer to estimate maximal oxygen consumption (VO2max) and maximum power at VO2max (PVO2max) [21]. In subsequent visits, participants were allocated to a control condition (CON) without exercise, and two aerobic exercise sessions (PE and SS). Random numbers were generated by an independent researcher through an Excel spreadsheet. There was an interval of 48-72 hours between each condition. Before and after each condition, the EEG, heart rate, feeling scale, and felt arousal scale were recorded. During and after each condition, heart rate, feeling scale, felt arousal, and ratings perceived exertion were recorded. All assessments were completed by the same evaluator, previously trained in the procedures applied.
Anthropometry
Participants’ body mass and height were measured (Filizola model 31, Filizola S.A., São Paulo, Brazil). Skinfolds were measured with a skinfold caliper (Sanny®, American Medical of Brazil Ltda., São Bernardo do Campo, SP). The procedures for verification of body mass, height and skinfolds followed the methods proposed by ISAK [22]. The body density and body fat percentage were calculated according to the equation of Jackson and Pollock and Siri, respectively [23, 24].
Estimation of Maximal Oxygen Consumption (VO2max)
The VO2max was estimated by a submaximal protocol on a cycle ergometry, according to Swain et al. [21]. The cadence was maintained at 60 revolutions per minute (rpm) throughout the test and the initial load (kg) was adjusted according to body weight. The increments were applied until approximately 55% of the heart rate reserve (HRR) was reached. From this moment, the work load was maintained for 6 min and then the test was finished. The estimation of VO2max and PVO2max was performed according to Swain et al. using the equation for metabolic cycle ergometry of ACSM [20, 21].
Heart Rate and Ratings of Perceived Exertion
Heart rate was measured by a heart rate monitor (Polar RS 400, Polar® Electro, Finland) and ratings of perceived exertion (RPE) were assessed using the Borg’s Scale (CR-10) with scores ranging from 0 (Nothing at all) to 10 (absolute maximum) [25].
Affective Responses
A dimensional perspective was applied to represent affective responses. Thus, the mean of two scales for the assessment of Valence and Activation were plotted on the Circumplex Model suggested by Ekkekakis [26]. The evaluation of affect was performed using the Feeling Scale (FS) and the Felt Arousal Scale (FAS). The FS is a measure of pleasure and displeasure scored between -5 (Very bad) and +5 (Very good), where the point 0 is categorized as “neutral” [27]. The FAS is a measure of arousal state scored between 1 (Low arousal)” and 6 (high arousal) [28]. To answer each scale, the participants were instructed to report how they felt at the exact time of measurement.
EEG Data Reduction and Analysis
The EEG signal was recorded by Braintech 3000 (EMSA-Medical Instruments, Brazil) of 20 channels. The system uses an analog to digital converter board (A/D) with 12-bit resolution. The EEG undergoes 0.01 Hz analog filtering (high pass) and 100 Hz (low-pass), being sampled at a rate of 240 Hz. We used a digital notch filter 60 Hz and high-pass filters also on 0.1 Hz and low pass at 50 Hz (Butterworth class 2).
Twenty monopolar electrodes were placed in the frontal areas (Fp1, Fp2, Fz, F3, F4, F7 and F8), central (Cz, C3 and C4), temporal (T3, T4, T5 and T6), parietal (Pz, and P3 P4) and occipital (Oz, O1 and O2) according to the International System 10/20 protocol [29]. Two other electrodes (A1 and A2) were positioned in the earlobes with reference function (bi-auricular). The impedance levels of each electrode were between 5 and 10 KOhms (KΩ). The resting EEG was recorded with eyes closed for 8 minutes. All subjects were instructed to avoid any movement, scanning of the eyes and tongue sweep.
A visual inspection of the data to remove artifacts epochs was performed using a rejection criterion of ±100 µV on any channel, in order to exclude blinks, eye movements, and movement related artifacts from the analyses. In addition, the estimation of signal components by Independent Component Analysis (ICA) was applied to minimize artifacts, such as sweating and muscle tension. After visual inspection and application of ICA to remove possible artifacts, EEG signals were processed on Matlab 5.3® software (The Mathworks, Inc.), using a software developed at the Brain Mapping and Sensory-Motor Integration Laboratory (UFRJ). This software extracted data relevant to the experiment. A classic Power Spectral Density (PSD) estimator was used (i.e. based on the squared absolute value of the Fourier Transform) for artifact-free 1-s EEG epochs (spectral resolution: 0.25 Hz) with Hamming windowing.
The log transformation was applied (natural log ln) on the power values, since the power of the EEG does not have a normal distribution between subjects. This procedure results in a near normal distribution. EEG data was used to compute cortical asymmetry according to the Davidson hypothesis [11]. The basic mathematical calculation to compute the asymmetry was computed for alpha frequency band (8-12 Hz) expressed by the equation: Asymmetry = InF4- InF3.
Experimental Sessions
Subjects were submitted to a control condition (CON) without exercise and two conditions of aerobic exercise (PE and SS) performed on a cycle ergometer, with condition sequence being randomized for each participant. PE was performed at 50% of PVO2max, 60 rpm and total duration of 20 minutes. Participants were instructed by the researcher to keep the rpm and predetermined load. SS subjects were free to choose load and rpm at any time. The subjects knew at all times which load and rpm they were using during exercise. It was up to each individual to establish the most appropriate strategy (“PACE”) during the 20 minutes. In the SS condition, the researcher did not interfere in the choice of both load and rpm. In the CON condition participants remained seated comfortably in a chair. Any interaction with participants was avoided to minimize the risk of changes on affective responses. Participants were not informed at what time the affection and physiological measures would be verified during and after exercise, since prior knowledge could lead participants to change the setting of exercise on SS condition.
Before the start of each session, the subjects were asked to remain seated in a comfortable chair, and then, after manual placement of the electrodes according to the International System 10-20, the subjects underwent an EEG examination lasting eight minutes. The resting EEG was recorded with eyes closed for 8 minutes before and after the conditions. All subjects were instructed to avoid any movement, scanning of the eyes and tongue sweep. In addition, heart rate was measured and participants were asked to answer the FS, FAS. Heart rate, FS, FAS and RPE assessment procedures were completed every 6 minutes during the experimental conditions (D6, D12, and D18), immediately after exercise (P0) as well as 10 and 20 minutes post-exercise (P10 and P20). After the experimental conditions, EEG recording had a slight delay so that researchers could place electrodes (average of eleven minutes).
Statistical Analysis
Data normality and heterogeneity was assessed using the Shapiro-Wilk and the Levene test, respectively. A two-way repeated measures ANOVA was performed to determine whether condition (CON x PE x SS) and moment (Pre x D6 x D12 x D18 x P0 x P10 x P20) had significant effects on HR, FS, and FAS. For ratings of perceived exertion (RPE) a two-way repeated measures ANOVA was performed to determine whether condition (CON x PE x SS) and moment (D6 x D12 x D18 x P0 x P10 x P20) had significant effects. A two-way repeated measures ANOVA was performed to determine whether condition (CON x PE x SS) and moment (pre-exercise x post-exercise) had significant effects on Frontal Asymmetry in the alpha frequency band (InF4-INF3).
Post-hoc analysis using the Bonferroni test was used to determine the specific differences between the conditions and moments for the dependent variable. If sphericity was violated on any of the repeated measures ANOVAs, the Greenhouse-Geisser correction was used. All the analysis were completed using the statistical package SPSS version 17 for Windows, with a significance level of p ≤ 0.05.
Another factor considered in the analysis was inter-individual variability in affective responses. To assess inter-individual variability, a descriptive analysis was performed using percentage values for changes in FS responses from pre-exercise to during exercise (D18).
RESULTS
Table 1 presents data on the characteristics of the participants.
| Variables | Mean | ± | SD | Minimum | Maximum |
|---|---|---|---|---|---|
| Age (anos) | 26.5 | ± | 3.8 | 22 | 33 |
| Weight (kg) | 76 | ± | 10 | 55.5 | 93 |
| Height (cm) | 175.6 | ± | 7.1 | 164 | 189 |
| Fat (%) | 14.4 | ± | 5.7 | 5.4 | 30 |
| Fat weight (kg) | 11.3 | ± | 5.6 | 4.3 | 27 |
| Fat-free mass (kg) | 64.7 | ± | 7.3 | 51.1 | 75.5 |
| VO2max (ml.kg.min-1) | 37.9 | ± | 6.6 | 31.7 | 56.1 |
HR and RPE
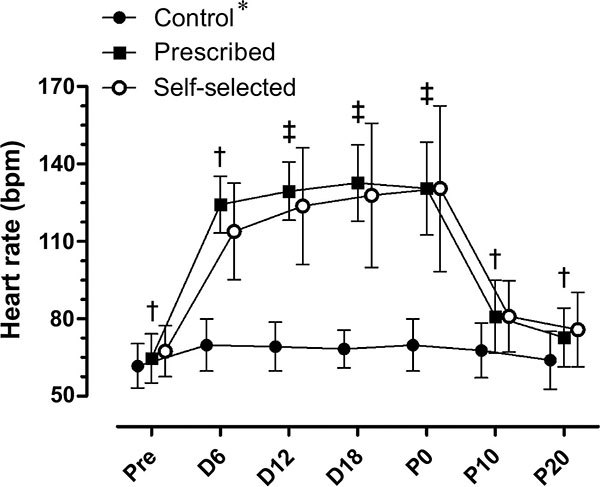
There was a significant condition by moment interaction in HR (F (12, 192) = 40.218; p≤0.0001). There were significant main effects for condition (F (2, 32) = 59.811; p≤0.0001), with higher values in the SS (103.6±4.4 bpm) and PE (105.5±2.4 bpm) conditions compared to CON (F = 67.1±2.2 bpm) (p≤0.0001). There were significant main effects for moment (F (6, 96) = 200.72; p≤0.0001). During the PE and SS conditions there was an increase in HR, followed by a return to resting values 20 minutes after exercise (D20) (Fig. 1).
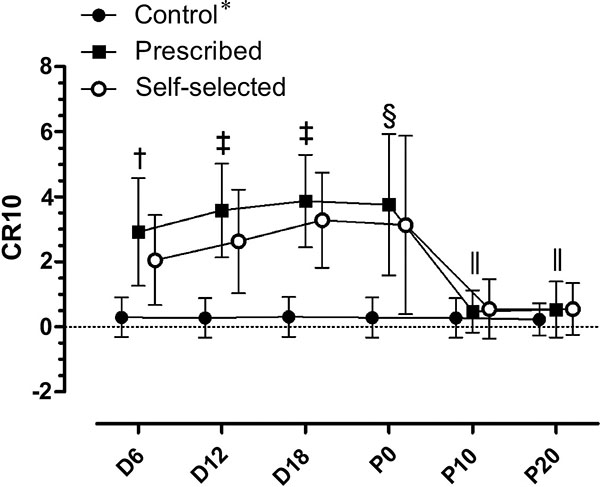
There was a significant condition by moment interaction in RPE (F (10, 180) = 14.289; p≤0.0001). There were significant main effects for condition (F (2, 36) = 42.960; p≤0.0001), with higher values in the SS (1.9±0.2) and PE (2.4±0.2) conditions compared to CON (0.1±0.1). There was no significant difference between PE and SS for the RPE (p=0.39). There were significant main effects for moment (F (5, 90) = 41.801; p≤0.0001), as shown in Fig. (2).
FS and FAS
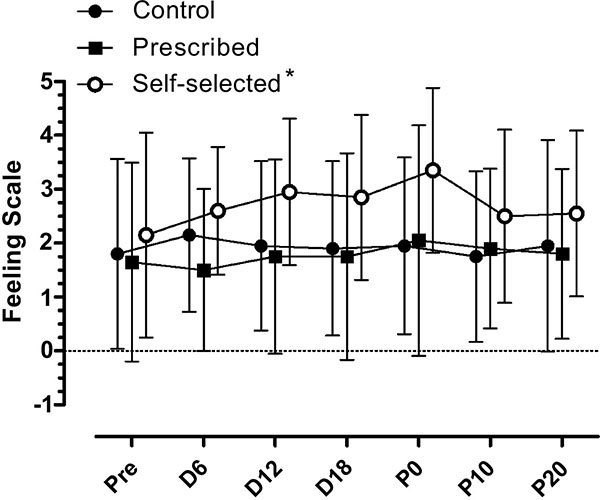
There was not a significant condition by moment interaction in FS (F (12, 228) = 1.083; p=0.375). There were also main effects for condition, (F (2,38) = 5.902; p=0.006) as the SS condition (2.7±0.2) showed higher values than the PE (1.7±0.2; p≤0.01) and CON condition (1.9±0.3; p≤0.01). There was no significant difference between the PE and the CON condition (p=1.0). There was no main effect for moment, (F (6, 114) = 1.415; p=0.215). The result of FS can be seen in Fig. (3).
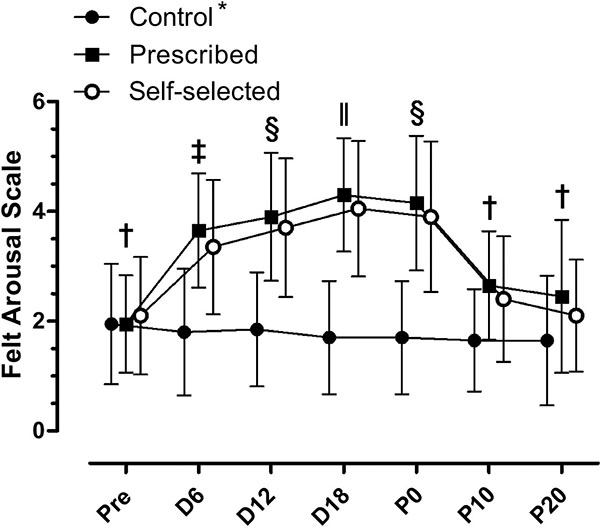
There was a significant condition by moment interaction in FAS (F (12, 228) = 14.972; p≤0.001). There were significant main effects for condition (F (2, 38) = 26.668; p≤0.001), as PE (3.2±0.1) and SS (3.0±0.2) showed higher values for FAS that CON (1.7±0.2) condition (p≤0.001). There were significant main effects for moment (F (6, 114) = 33.650; p≤0.001). In both experimental conditions (PE and SS), there was an increase in the activation during the execution of the exercise (D6, D12 and D18) compared to CON condition. These results are shown in Fig. (4).
The affective responses were also represented using the circumplex model suggested by Ekkekakis [26] (Fig. 5).
Fig. (5) goes here.
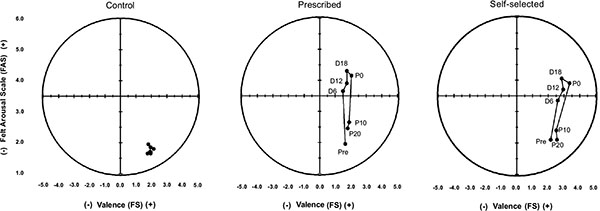
In the CON condition, subjects remained in the lower right quadrant, which represents a positive affect deactivation. In the exercise condition (PE and SS), the subjects remained within the positive affect quadrant during exercise and returned to the lower right quadrant (positive affect deactivation) after the exercise ended.
Inter-individual Variability
To assess individual variation in psychological responses between each condition, a descriptive analysis was performed using percentage values as described in Table 2.
| Prescribed | Self-selected | Control | |
|---|---|---|---|
| Increase | |||
| Number | 9 | 11 | 5 |
| % change | 45% | 55% | 25% |
| Decrease | |||
| Number | 7 | 6 | 4 |
| % change | 35% | 30% | 20% |
| No change | |||
| Number | 4 | 3 | 11 |
| % change | 20% | 15% | 55% |
Frontal Asymmetry (InF4-InF3)
There was no significant condition by moment interaction (F (2, 38) = 0.515; p=0.6), or main effects for condition (F (2, 38) = 2.345; p=0.11) and moment (F (1, 19) = 2,207; p = 0.15) in alpha frontal asymmetry (InF4-InF3).
DISCUSSION
The aim of this study was to compare affective responses and frontal EEG asymmetry induced by PE and SS exercise sessions.
The literature has consistently demonstrated that high intensity exercise (above ventilatory threshold) generates affective responses reduction [7, 18, 19, 30]. However, findings comparing affective responses between PE and SS exercise have been somewhat inconsistent in the literature. Lind et al. [19] compared a 20 minutes PE protocol using the treadmill with an intensity 10% higher that the SS exercise session. In the PE condition there was a decrease in pleasure while this outcome was stable and positive during the exercise on the SS condition. However, previous studies comparing PE and SS with the same intensity showed no significant differences for affective responses between both conditions [30-32]. A meta-analysis also showed no differences in affective responses between PE and SS exercise performed at the same intensity [33].
Considering that there was no difference in exercise intensity between the experimental conditions (PE and SS), it is assumed that intensity was not the predominant factor for explaining the positive emotional responses found after the SS condition in our study. According to Ekkekakis, cognitive factors are crucial to the emotional response generated from low intensity exercise [7]. This pattern is described by the dual-mode theory which states that the lactate or ventilatory threshold is the mediator for affective response. Although the mechanisms for this pattern are not well established, previous studies detected this pattern through correlations between Feeling Scale and cognitive and physiological variables in different exercise intensities [7]. There is greater inter-individual variability in affective responses when exercise intensity is below and on the lactate threshold [17, 18, 34]. For example, in the study by Parfitt et al. positive changes were found in the SS condition, with 92% of subjects showing increases in positive affect during exercise, while only 8% remained unchanged [17]. In our study, 55% displayed increases in positive affect, 30% decreased and 15% remained unchanged.
No changes in the EEG frontal asymmetry were observed in our results. The hypotheses that the SS condition would result in a right-ward asymmetry, with higher alpha power in the right prefrontal cortex in comparison to the left prefrontal cortex after exercise was not observed. For Coan and Allen [35] frontal EEG asymmetry appears to serve as an individual difference variable related to emotional responding, and a state-dependent concomitant of emotional responding, consisting in a electroencephalographic measure of trait and state. There is the possibility of exercise inducing changes in emotional state and concomitant changes in frontal asymmetry. There are studies establishing the predictive role of frontal asymmetry on exercise responses [14, 15]. However, the ability of exercise to induce changes in frontal asymmetry remains unclear.
Petruzzelo & Tate showed that frontal asymmetry predicted positive affect immediately after exercise; using intensities close to the ventilatory threshold (70% of VO2max) with no significant results were seen in the control or 55% conditions [14]. In the 70% exercise condition, greater relative left frontal activation pre exercise predicted increased positive affect and reduced state anxiety post exercise [14]. These findings suggest a dose-response intensity effect, and support the idea that exercise is an emotion-eliciting event, and affective responses seem to be mediated in part by differential resting levels of activation in the anterior brain regions. However, the optimal intensity needed to elicit a positive affective response is controversial, and in addition, the mechanisms underlying such a response are unclear. For example, in the study by Woo et al. frontal EEG asymmetry and self-reported vigor scores following exercise at all three intensities (45%, 60% and 75% VO2max) were significantly elevated compared to those observed following rest [15]. The results suggest that aerobic exercise bouts executed at varying intensities induce a similar affective response during the recovery period.
The influence of acute bout of SS aerobic exercise was investigated as possible mediator this relationship with affective responses to an and resting brain activation [10]. Participants walked on a treadmill for 10 min and were free to adjust the treadmill speed to using the buttons on a control panel in two separate occasions and followed identical procedures each time. Affective responses were recorded pre, immediately postwalk, and 15 min postwalk. Baseline EEG was recorded before of walk, and heart rates, and rating of perceived exertion (RPE) were recorded on the 5th and 10th (final) minute of the walk. Resting frontal EEG asymmetry was unable to predict postwalk affect (i.e. state anxiety, energetic or tense arousal) either immediately or at 15-min postwalk. There were correlations between the days (first and second day) for heart rate (day 1/5-min, = 95.1±14.7 and day 2/5-min= 96.6±14.1, r=0.72; day 1/10-min, = 99.3±19.0; day 2/10-min= 99.1±18.2, r=0.81), and RPE (day 1/5-min, = 8.6±1.5 and day 2/5-min= 8.8±1.8, r=0.64; day 1/10-min, = 9.6±2.2 and day 2/10-min= 9.6±2.4, r=0.78) all times recorded. The exercise intensity was approximately 20% of heart rate reserve (99.3±19.0), which is slightly below that seen in our study (103.6±4.4 bpm). These findings indicate that there may be important dose-dependent differences in the processes underlying the generation of exercise-associated affective responses
One major limitation of this study is the lack of information regarding participants’ physical activity levels. The participants’ aerobic fitness was mediated this relationship with affective responses to an acute bout of aerobic exercise and resting brain activation [13]. Resting EEG asymmetry predicted positive affect post exercise only in subjects with aerobic fitness high levels. It was also shown that subjects with relatively greater left frontal activation had significantly more energy (i.e., activated pleasant affect) following exercise than subjects with relatively greater right frontal activation. Subjects with relatively greater left frontal activation had significantly more energy (i.e., activated pleasant affect) following exercise than subjects with relatively greater right frontal activation. This could play a huge role in affective responses. The greater enjoyment associated with high-intensity interval running was seen in recreationally active men [36].
CONCLUSION
SS was more effective to induce positive changes in the affective state. Public health practitioners can consider self-selected intensity as an appropriate option. The hypothesis of frontal asymmetry being present after the SS condition has not been confirmed. Perhaps the asymmetric state of the frontal cortex may reflect a trait feature, since no change has occurred in frontal asymmetry following any condition. Future research should further examine how frontal asymmetry is associated with emotional changes during and after workout. Better understanding between frontal asymmetry, exercise and affection can help provide practical recommendations regarding exercise prescription.
LIST OF ABBREVIATIONS
| ACSM | = American College of Sports Medicine |
| Bpm | = Beats per minute |
| CON | = Control |
| CR-10 | = Borg’s Scale |
| EEG | = Electroencephalography |
| FA | = Fourier analysis |
| FAS | = Felt Arousal Scale |
| FFT | = Fast Fourier Transform |
| FS | = Feeling scale |
| HR | = Heart rate |
| HRrest | = Resting heart rate |
| HRR | = Heart rate reserve |
| ICA | = Independent Component Analysis |
| PE | = Prescribed exercise |
| PVO2max | = Maximum power associated with VO2max |
| RPE | = Ratings of perceived exertion |
| Rpm | = Revolutions per minute |
| SA | = Spectral Analysis |
| SD | = Standard deviation |
| SS | = Self-selected |
| VO2max | = Maximal oxygen consumption |
CONFLICT OF INTEREST
The authors confirm that this article content has no conflict of interest.
ACKNOWLEDGEMENTS
The authors acknowledge the financial support of the Conselho Nacional de Desenvolvimento Científico e Tecnológico (CNPq) and the Coordenação de Aperfeiçoamento de Pessoal de Nível Superior (CAPES) for the financial support.

