All published articles of this journal are available on ScienceDirect.

Should Unexplained Painful Physical Symptoms be Considered within the Spectrum of Depressive Symptoms?
Authors Info & Affiliations
Abstract
Objective:
To examine whether painful physical symptoms (PPS) can be considered within the spectrum of depressive symptoms.
Methods:
Data for this post-hoc analysis were taken from a 6-month observational study mostly conducted in East Asia, Mexico, and the Middle East of 1,549 depressed patients without sexual dysfunction at baseline. Both explanatory and confirmatory factor analyses (EFA and CFA) were performed on the combined items of the 16-item Quick Inventory of Depressive Symptomatology Self-Report and the Somatic Symptom Inventory (seven pain-related items only). An additional second-order CFA was also conducted to examine an association between retained factors and the overall “depressive symptoms” factor. In addition, Spearman’s correlation was used to assess levels of correlation between retained factors and depression severity as well as quality of life.
Results:
Both EFA and CFA suggested and validated a four-factor solution, which included a pain factor. The other three factors identified were a mood/cognitive factor, a sleep disturbance factor, and an appetite/weight disturbance factor. All four factors were significantly associated with the overall factor of depression. They were also highly correlated to depression severity and quality of life (p<0.001 for all). The levels of correlations with the pain factor were generally greater than those with the appetite/weight factor and similar to those with the sleep factor.
Conclusion:
It may be reasonable to consider PPS within a broad spectrum of depressive symptoms. At least, they should be routinely assessed in patients with depression. Further research is warranted to validate these preliminary findings.
INTRODUCTION
Depression is one of the most prevalent, disabling and costly mental disorders, currently affecting nearly 350 million people worldwide [1]. Many patients with depression often experience both psychological and somatic symptoms [2, 3]. Indeed, somatic manifestations of unipolar depression are frequently observed in both inpatient and outpatient care settings across all cultures [4], and that somatic symptoms are often the main reason for the initial visit to the primary care physician [5].
The high prevalence of somatic symptoms in unipolar depression has been recognised and partially reflected in contemporary diagnostic criteria such as those specified in the Diagnostic and Statistical Manual of Mental Disorders-editions [6, 7], which give an important emphasis to those somatic symptoms such as insomnia, weight loss, appetite change, fatigue, and psychomotor retardation [8]. Similarly, several somatic symptoms have also been included in widely-used depression rating scales such as the Hamilton Rating Scale for Depression (HRSD) [9], the Montgomery–Åsberg Depression Rating Scale (MADRS) [10], the Beck Depression Inventory (BDI) [11], and the Inventory of Depressive symptomatology (IDS) [12, 13].
A number of factor analytic studies on these rating scales in patients with unipolar depression have identified the somatic symptom components in the factor structure of the scales [14]. For instance, Gullion and Rush [14] performed a factor analysis on the combined items of the IDS, the HRSD, and the BDI collected from 324 outpatients with major depressive disorder (MDD), and identified the following ten primary factors: “hedonic capacity”, “self-blame”, “suicide/hopelessness”, “lack of energy”, “sleep disturbance”, “decreased libido”, “somatic anxiety”, “anxious/irritable”, “sleep onset insomnia”, and “appetite disturbance/weight change”. Other factor analytic studies on single measures have identified fewer factors but still identified the somatic symptom component. With the HRSD-17 data from 186 patients with depression, Pancheri et al. identified the following four factors: “somatic anxiety/somatisation” factor, a “psychic anxiety dimension”, a “pure depressive dimension”, and “anorexia” factor [15]. Similarly, another factor analysis, using the IDS-28 and IDS-30 data from 353 depressed outpatients, found “cognitive/mood”, “anxiety/arousal”, and “sleep and appetite regulation” factors for each scale [12].
Nevertheless, the question on which symptoms are specific to clinical depression still remains unanswered. That is, there are still disputes on the array of symptoms that constitutes the depressive syndrome and on the use of adequate symptom measures [14]. Different scales include different items, and consequently factor analytic studies of the rating scales have often produced different results in terms of factor numbers and contents [e.g., 12, 16-18]. The choice of the items may depend on the goal of a rating scale. The scale can be unidimensional if it aims to measure “general depression severity”, or multidimensional if it aims to identify and measure different subtypes having different symptom profiles.
Painful physical symptoms (PPS) could potentially be considered another array of depressive symptoms, although the rating scales widely available rarely include these symptoms. Notably, PPS such as headaches, abdominal pain, heart/chest pain, and back pain are one of the most frequent complaints in patients with depression. These symptoms have been reported by up to 73% of outpatients with depression [5, 19-21]. Moreover, the majority of patients with depression report multiple pain complaints and more pain symptoms have been associated with greater severity of depression [22].
Given a strong link between pain and depression, our study aimed to understand whether PPS could be considered within the spectrum of depressive symptoms, using data from a 6-month, prospective, observational study with patients with MDD mostly from East Asia, Mexico and the Middle East. In doing so, both explanatory and confirmatory factor analyses were performed on the combined items of the16-item Quick Inventory of Depressive Symptomatology-Self Report (QIDS-SR16) [23] and the Somatic Symptom Inventory (SSI) (pain-related items only) [24] to examine a factor structure of these items.
METHODS
Study Design
Data for this post-hoc analysis were taken from a 6-month, international, prospective, non-interventional, observational study, primarily designed to examine treatment-emergent sexual dysfunction (TESD) and other treatment outcomes among patients with MDD who were treated with either a selective serotonin reuptake inhibitor (SSRI) or a serotonin-norepinephrine reuptake inhibitor (SNRI) in actual clinical practice. A total of 1,647 patients were enrolled at 88 sites between 15 November 2007 and 28 November 2008. Of these, the 1,549 patients were classified as “sexually active patients without sexual dysfunction at study entry”, and included in the study. The patients were drawn from the following countries and regions across the globe: East Asia (China [n=205; 13.2%], Hong Kong [n=18; 1.2%], Malaysia [n=33; 2.1%], the Philippines [n=113; 7.3%], Taiwan [n=199; 12.8%], Thailand [n=17; 1.1%], and Singapore [n=2; 0.1%]), the Middle East (Saudi Arabia [n=179; 11.6%] and United Arab Emirates [n=135; 8.7%]), Mexico (n=591; 38.2%), and other regions (Israel [n=9; 0.6%] and Austria [n=48; 3.1%]). This study followed the ethical standards of responsible local committees and the regulations of the participating countries, and was conducted in accordance with the ethical principles that have their origin in the Declaration of Helsinki and are consistent with Good Clinical Practice (GCP) where applicable to a study of this nature. Ethical Review Board (ERB) approval was obtained as required for observational studies wherever required by local law. All patients provided informed consent for the provision and collection of the data. Further details of the study design have been published elsewhere [25, 26].
Study Population
Patients (outpatients) were eligible to participate in the study if they met the following inclusion criteria: (1) presented with an episode of MDD within the normal course of care, with MDD diagnosed according to the International Statistical Classification of Diseases 10th revision (ICD-10) [27] or Diagnostic and Statistical Manual of Mental Disorders-4th edition text revision (DSM-IV-TR) [7] criteria; (2) were at least moderately depressed, defined by the Clinical Global Impression-Severity scale (CGI-S) (with a score of ≥4) [28]; (3) were initiating or switching to any available SSRI or SNRI antidepressant in accordance with each country’s approved labels and at the discretion of the participating psychiatrist; (4) at least 18 years of age; (5) sexually active (with partner or autoerotic activity, including during the 2 weeks prior to study entry) without sexual dysfunction, as defined by Arizona Sexual Experience Scale [29]; (6) not participating in another currently ongoing study; and (7) provided consent to release data. The study excluded the patients who had the following: (1) a history of treatment-resistant depression (defined as failure to respond to treatment with two different antidepressants from different classes at therapeutic doses for ≥4 weeks); (2) a past or current diagnosis of schizophrenia, schizophreniform or schizoaffective disorder, bipolar disorder, dysthymia, mental retardation or dementia; or (3) received any antidepressant within 1 week (1 month for fluoxetine) prior to study entry, with the exception of patients receiving an ineffective treatment for whom the immediate switch to an SSRI or SNRI antidepressant was considered to be the best treatment option. Patients who changed or discontinued medication after entry remained in the study unless lost to follow-up or consent was withdrawn. Treatment decisions were made solely at the discretion of the treating psychiatrist, and were independent of study participation. Patients were not required to continue taking the medication initiated at baseline. Changes in medication and dosing as well as the use of concomitant medications and non-pharmacological therapies for the treatment of depression were possible at any time as determined by the treating psychiatrist.
Data Collection and Outcome Assessment
Data collection for the study occurred during visits within the normal course of care. The routine outpatient visit at which patients were enrolled served as the time for baseline data collection. Subsequent data collection was targeted at 8, 16 and 24 weeks since the baseline visit. Patient demographics and clinical history were recorded at the baseline assessment.
Depression and Pain Measures for Factor Analysis
Clinical severity of depression was assessed at each visit using the QIDS-SR16 [23], which isa shorter version of the 30-item Inventory of Depressive symptomatology [12, 13]. It is a patient-rated, 16-item instrument designed to assess the severity of depressive symptoms in the past seven days. It covers the nine diagnostic symptom domains used to characterise a major depressive episode, without items to assess atypical, melancholic or their commonly associated symptoms. It includes the following 16 items: (1) falling asleep (sleep onset insomnia); (2) sleep during the night (mid-nocturnal insomnia); (3) waking up too early (early morning insomnia); (4) sleeping too much (hypersomnia); (5) feeling sad; (6) decreased appetite or (7) increased appetite; (8) decreased weight (within the last two weeks) or (9) increased weight (within the last two weeks): (10) poor concentration/decision-making; (11) view of myself (self-criticism or blame); (12) suicidal thoughts; (13) low level of general interest; (14) low level of energy; (15) feeling slowed down (psychomotor retardation); and (16) feeling restless (psychomotor agitation). Item responses are ranked from 0 to 3, with higher scores corresponding with more frequent symptoms/problems. In the current factor analysis, items 6 and 7 (increased and decreased appetite) and items 8 and 9 (increased and decreased weight) were combined into single items respectively (i.e., appetite disturbance for the former and weight change for the latter) because patients were required to complete only one of each.
Depression-related pain severity was measured using the seven pain-related items of the 28-item modified SSI (muscle soreness, abdominal pain, lower back pain, heart/chest pain, joints pain, neck pain, and headaches) [21, 24]. It is a patient self-report scale that assesses the extent to which each of 28 somatic symptoms has bothered the patient over the previous week, using a scale ranging from 1 (“not at all”) to 5 (“a great deal”) [24]. Of the 28 somatic symptoms, only the seven pain-related items were administered to the patients and were, therefore, included in this factor analysis.
Other Outcome Measures
Overall clinical severity was assessed at each visit by treating psychiatrists using the CGI-S [28]. It is rated on a 7-point scale, ranging from 1 (normal, not at all ill) to 7 (extremely ill).
Patient perception of quality of life was also assessed using the EuroQoL-5 Dimensions (EQ-5D).This instrument has five items (mobility, self-care, usual activities, pain/discomfort, and anxiety/depression), each of which is scored on a scale from 1 (no problems) to 3 (extreme problems). Given that there are no single representative EQ-5D tariffs or country-specific tariffs for all countries included in this study, the commonly used UK tariff was applied to the EQ-5D data to calculate the utility score [30].The EQ-5D questionnaire also includes a visual analogue scale (EQ-VAS) on which patients were asked to rate their current overall health that day on a scale from 0 (worst imaginable health state) to 100 (best imaginable health state), thus providing an overall ‘health state’ score.
Statistical Analysis
The current study included a total of 1,332 patients who initiated either duloxetine or an SSRI as monotherapy at baseline for the treatment of MDD, and who did not have missing data on the QIDS-SR16 score at baseline with at least one assessable QIDS-SR16 score during follow-up.
The sample was randomly divided into two subsamples for explanatory factor analysis (EFA) and subsequent confirmatory factor analysis (CFA) to identify and validate a factor structure of the combined QIDS-SR16 and SSI-pain related items. The baseline patient characteristics between the two subsamples were compared and tested using the Chi-square test (for categorical variables) and t-tests (for continuous variables).
EFA on the ordinal responses of the QIDS-SR16 and the SSI-pain related items collected at baseline was first carried out with the first half of the sample to extract a factor solution, using a polychoric correlation matrix and the mean- and variance-adjusted weighted least square (WLSMV) estimates. A genomic rotation, which is an oblique type of rotation that allows the factors to correlate, was also used.
The best factor solution was determined based on Kaiser’s criterion (eigenvalues above 1), inspection of the screeplot, and the fit indices such as the Root Mean Square Error of Approximation (RMSEA), the Comparative Fix Index (CFI), the Tucker-Lewis Index (TLI), and the Standardised Root Mean Square (SRMR). The following values indicate the cut-off for a good model fit: the RMSEA value of <0.06, the CFI value of >0.90 (preferably 0.95), the TLI value of >0.95, and the SRMR value of <0.08 [31]. In addition, factor loadings after rotation were examined to load the items onto a particular factor, based on factor loadings (i.e. a loading [absolute value] of at least 0.3) and clinical judgement.
CFA was then applied to the second half of the sample to evaluate the model derived through EFA on the first half-sample. It was performed on the ordinal responses of the QIDS-SR16 and the SSI-pain items collected at baseline but also at each post-baseline visit. Given that we combined the items of two measures (i.e. QIDS-SR16 and SSI pain-related items), a second-order factor analysis (i.e. adding an overall factor of “depressive symptoms” to the best factor solution identified in EFA) was also conducted to examine the relationship of each factor (i.e., first-order factor) with an overall factor (i.e. second-order factor). The fit of the models was assessed using the following fit indices: RMSEA, CFI, and TLI.
In addition, the levels of correlation between each factor and outcome measures (i.e., clinical severity [CGI-res] and quality of life [EQ-es]) at each visit were also examined using Spearman’s correlation to check the relevance of each factor in explaining the outcome measures. The scores of each factor were computed as the sum of the items that formed the factor.
Descriptive statistics were obtained using SAS version 9.3 software for Windows (SAS Institute, Cary, NC, USA), and all factor analyses were performed using Mplus version 7.2 software (Muthén & Muthén, Los Angeles, CA, USA).
RESULTS
Patient Characteristics at Study Entry
Table 1 describes the demographic and clinical characteristics of the 1,332 patients at baseline. The mean age (standard deviation [SD]) of the patients was 38.0 years (SD=10.5) and 56.5% were female. More than one in three were from Mexico (42.2%), followed by East Asia (34.2%), the Middle East (21.1%) and other regions (i.e., Israel and Austria, 2.6%). Approximately two-thirds of the patients (65.7%) had experienced a depressive episode in the 24 months prior to baseline. In addition, about one in four (25.6%) had at least one comorbidity at baseline, and about half of the patients (51.5%) had painful physical symptoms (defined as a mean score of ≥2 for the SSI pain-related items [21]). A total of 556 patients (41.7%) initiated duloxetine and the rest (58.3%) initiated an SSRI at baseline. Depression severity at baseline was moderate to severe, as demonstrated by the CGI-S score (mean=4.5, SD=0.7) and the QIDS-SR16 score (mean=14.4, SD=4.8). The level of quality of life was relatively lower, as demonstrated by the EQ-5D score (mean=0.47, SD=0.33) and EQ-VAS score (mean=43.2, SD=25.9).
Baseline patient characteristics.
| Baseline Characteristic | Subset 1 (n=666) |
Subset 2 (n=666) |
Total (n=1,332) |
|---|---|---|---|
| Age, mean (SD) | 37.8 (10.5) | 38.2 (10.5) | 38.0 (10.5) |
| Female, % | 56.6 | 56.3 | 56.5 |
| Region, % | |||
| East Asia | 34.5 | 33.8 | 34.2 |
| Mexico | 40.8 | 43.5 | 42.2 |
| The Middle East | 22.5 | 19.7 | 21.1 |
| Other region | 2.1 | 3.0 | 2.6 |
| Age at first symptoms of MDD, mean (SD) | 33.6 (11.3) | 33.8 (11.1) | 33.7 (11.2) |
| BMI (kg/m2), mean (SD) | 24.8 (4.3) | 24.6 (4.3) | 24.7 (4.3) |
| Living with a spouse/partner, % | 65.9 | 64.6 | 65.2 |
| Educational attainment, % | |||
| ≤ Primary school | 7.4 | 9.2 | 8.3 |
| Secondary school/occupational programme | 44.7 | 43.3 | 44.0 |
| ≥ University | 47.9 | 47.6 | 47.8 |
| Employment status, % | |||
| Full-time | 55.9 | 55.3 | 55.6 |
| Economically inactive | 27.0 | 25.1 | 26.1 |
| Unemployed/part-time | 17.1 | 19.7 | 18.4 |
| CGI-S score at baseline, mean (SD) | 4.5 (0.7) | 4.5 (0.7) | 4.5 (0.7) |
| QIDS-SR16 score at baseline, mean (SD) | 14.2 (4.9) | 14.5 (4.8) | 14.4 (4.8) |
| EQ-VAS score at baseline, mean (SD) | 43.6 (26.1) | 42.7 (25.7) | 43.2 (25.9) |
| EQ-5D index at baseline, mean (SD) | 0.48 (0.33) | 0.46 (0.33) | 0.47 (0.33) |
| SSI-pain score at baseline, mean (SD) | 14.5 (5.1) | 14.3 (5.1) | 14.4 (5.1) |
| Had MDD episodes in the 24 months prior to baseline, % | 65.8 | 65.6 | 65.7 |
| Had been hospitalised for MDD in the 24 months prior to baseline, % | 5.3 | 5.4 | 5.3 |
| Initiating treatment with SSRIs (vs. duloxetine), % | 58.9 | 57.7 | 58.3 |
| Having significant co-morbidities, % | 24.3 | 26.8 | 25.6 |
| Painful physical symptoms, % | 53.0 | 49.9 | 51.5 |
Abbreviations: BMI, Body Mass Index; CGI-S, Clinical Global Impressions of Severity; EQ-VAS, EuroQoL-Visual Analogue Scale; EQ-5D, EuroQoL-5 Dimensions; MDD, Major Depressive Disorder; QIDS-SR16, 16-item Quick Inventory of Depressive Symptomatology Self-Report; SD, Standard Deviation; SSI-pain, Somatic Symptom Inventory; SSRI, Selective Serotonin Reuptake Inhibitor
Pattern of factors after rotation in explanatory factor analysis using the baseline data.
| Items (QIDS-SR16 and SSI pain-related items) | Factors | |||
|---|---|---|---|---|
| Factor I | Factor II | Factor III | Factor IV | |
| 1. Sleep onset insomnia | 0.04 | 0.72 | 0.10 | -0.01 |
| 2. Mid-nocturnal insomnia | -0.01 | 0.72 | 0.004 | 0.08 |
| 3. Early morning awakening | 0.06 | 0.67 | -0.14 | 0.03 |
| 4. Hypersomnia | 0.38 | -0.34 | -0.20 | 0.07 |
| 5. Feeling sad | 0.68 | -0.01 | 0.13 | -0.01 |
| 6+7. Appetite disturbance | 0.17 | 0.01 | 0.71 | 0.000 |
| 8+9. Weight disturbance | 0.04 | -0.02 | 0.77 | 0.06 |
| 10. Concentration/decision-making | 0.74 | 0.06 | 0.01 | -0.03 |
| 11. Self-criticism and blame | 0.49 | 0.03 | 0.17 | 0.02 |
| 12. Suicidal thoughts | 0.26 | 0.09 | 0.34 | 0.07 |
| 13. Interest in people/activities | 0.69 | -0.01 | 0.12 | -0.04 |
| 14. Energy/fatigability | 0.76 | 0.03 | 0.04 | 0.004 |
| 15. Psychomotor retardation | 0.61 | 0.12 | -0.08 | 0.07 |
| 16. Psychomotor agitation | 0.29† | 0.19 | 0.07 | 0.01 |
| 17. Muscle soreness | 0.03 | 0.01 | -0.05 | 0.80 |
| 18. Abdominal pain | -0.21 | 0.02 | 0.20 | 0.64 |
| 19. Lower back pain | 0.09 | -0.06 | 0.02 | 0.70 |
| 20. Heart/chest pain | -0.05 | 0.06 | 0.23 | 0.54 |
| 21. Joints pain | -0.06 | 0.03 | 0.01 | 0.74 |
| 22. Neck pain | 0.23 | -0.11 | 0.01 | 0.70 |
| 23. Headache | 0.15 | 0.08 | -0.11 | 0.55 |
| Interpretation | Mood/ cognitive |
Sleep disturbance | Appetite/ weight disturbance |
Pain |
Note 1: Bolded items indicate major loadings for each item, which were finally loaded onto the factors based on their loading values (i.e., an absolute value of >0.3) and clinical judgement.
Note 2: Item 1-16 are the items included in the 16-item Quick Inventory of Depressive Symptomatology Self-Report (QIDS-SR16), and Item 17-23 are the seven pain-related items of the Somatic Symptom Inventory (SSI). Factor analysis was performed with a total of 21 items (item 6 and 7 as well as item 8 and 9 were combined into one item, respectively).
Standardised factor loadings in confirmatory factor analysis using the baseline data.
| Items (QIDS-SR16 and SSI pain-related items) | Factors | ||||
|---|---|---|---|---|---|
| Mood/ cognitive |
Sleep disturbance |
Appetite/ Weight disturbance |
Pain | R2 | |
| 1. Sleep onset insomnia | 0.74 | 0.55 | |||
| 2. Mid-nocturnal insomnia | 0.78 | 0.61 | |||
| 3. Early morning awakening | 0.67 | 0.44 | |||
| 4. Hypersomnia | 0.38 | -0.36 | 0.14 | ||
| 5. Feeling sad | 0.65 | 0.43 | |||
| 6+7. Appetite disturbance | 0.97 | 0.94 | |||
| 8+9. Weight disturbance | 0.64 | 0.41 | |||
| 10. Concentration/decision-making | 0.76 | 0.57 | |||
| 11. Self-criticism and blame | 0.58 | 0.33 | |||
| 12. Suicidal thoughts | 0.52 | 0.27 | |||
| 13. Interest in people/activities | 0.77 | 0.59 | |||
| 14. Energy/fatigability | 0.74 | 0.55 | |||
| 15. Psychomotor retardation | 0.74 | 0.54 | |||
| 16. Psychomotor agitation | 0.51 | 0.26 | |||
| 17. Muscle soreness | 0.76 | 0.58 | |||
| 18. Abdominal pain | 0.63 | 0.39 | |||
| 19. Lower back pain | 0.78 | 0.60 | |||
| 20. Heart/chest pain | 0.62 | 0.38 | |||
| 21. Joints pain | 0.76 | 0.58 | |||
| 22. Neck pain | 0.77 | 0.59 | |||
| 23. Headache | 0.68 | 0.47 | |||
Note 1: R2 is the proportion of the item variance that is explained by the factor.
Note 2: Item 1-16 are the items included in the 16-item Quick Inventory of Depressive Symptomatology Self-Report (QIDS-SR16), and Item 17-23 are the seven pain-related items of the Somatic Symptom Inventory (SSI). Factor analysis was performed with a total of 21 items (item 6 and 7 as well as item 8 and 9 were combined into one item, respectively).
Level of correlations between the four factors retained and outcomes of depression (symptom severity and quality of life).
| Outcomes | Mood/ cognitive |
Sleep disturbance | Appetite/ Weight disturbance |
Pain |
|---|---|---|---|---|
| At baseline | ||||
| QIDS-SR16 | 0.958 | 0.552 | 0.530 | 0.286 |
| CGI-S | 0.427 | 0.223 | 0.106 | 0.104 |
| EQ-VAS | -0.296 | -0.134 | -0.201 | -0.176 |
| EQ-5D | -0.481 | -0.215 | -0.244 | -0.344 |
| At 24 weeks | ||||
| QIDS-SR16 | 0.919 | 0.744 | 0.547 | 0.559 |
| CGI-S | 0.735 | 0.491 | 0.214 | 0.411 |
| EQ-VAS | -0.436 | -0.324 | -0.170 | -0.308 |
| EQ-5D | -0.654 | -0.484 | -0.264 | -0.557 |
Note: p-value <0.001 for all correlations
Abbreviations: CGI-S, Clinical Global Impressions of Severity; EQ-VAS, EuroQoL-Visual Analogue Scale; EQ-5D, EuroQoL-5 Dimensions; QIDS-SR16, 16-item Quick Inventory of Depressive Symptomatology Self-Report
This patient sample was randomly split into two groups: sample 1 for EFA and sample 2 for CFA. They were virtually identical with no statistically significant differences on any measures/variables collected.
Results of EFA and CFA
The explanatory factor analysis on a total of 21 items from the QIDS-SR16 (14 items) and the SSI (7 pain-related items) was first performed with the first half of the sample. The scree plot, presented in Fig. (1), demonstrates the eigenvalues of each additional factor (i.e., the variance that is accounted for by that factor). The eigenvalues dropped below 1 and reached a “plateau” at the 5th factor (1.431 for the 4th factor and 0.928 for the 5th factor), suggesting a four-factor solution. The following fit indices also confirmed a good fit of the four factor model: RMSEA=0.041; CFI=0.979; TLI=0.967; and SRMR=0.029.
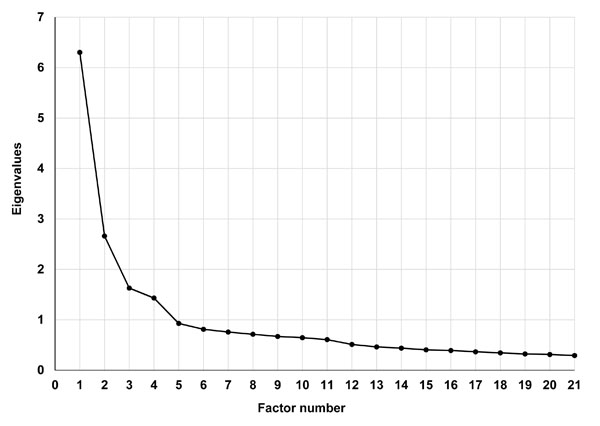
A scree plot for the eigenvalues of unrotated factors.
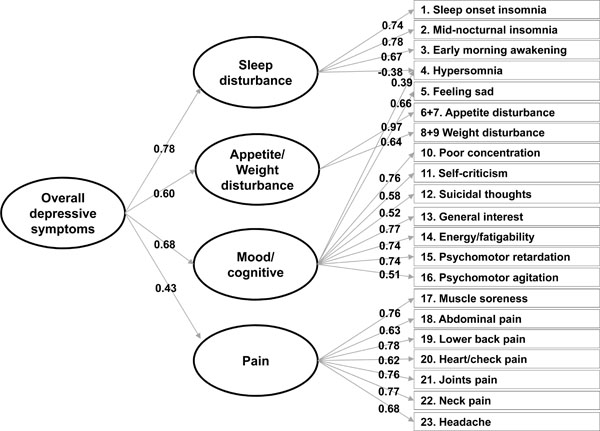
Standardised factor loadings in confirmatory factor analysis with a second-order factor model using the baseline data.
Table 2 presents the item loadings on each factor after the geomin rotation. The items assigned to each relevant factor, based on factor loadings (i.e. a loading [absolute value] of at least 0.3) and clinical judgement, are highlighted in bold in Table 2. Each factor was composed of two to nine items. The first factor (factor I), “mood/cognitive factor”, consisted of nine items: hypersomnia; feeling sad; concentration/decision-making; self-criticism and blame; suicidal thoughts; interest in people/activities; energy/fatigability; psychomotor retardation; and psychomotor agitation. The second factor (factor II), “sleep disturbance”, was composed of four items: sleep onset insomnia; mid-nocturnal insomnia; early morning insomnia; and hypersomnia. The third factor (factor III), “appetite/weight disturbance”, consisted of two items: appetite disturbance and weight change. Finally, factor IV, “pain”, consisted of seven items: muscle soreness; abdominal pain; lower back pain; check/heart pain; joint pain; neck pain; and headache. The two items, suicidal thoughts (0.26) and psychomotor agitation (0.29), were loaded onto the first “mood” factor according to clinical judgement, although their factor loadings were slightly below 0.3 Similarly, the item, suicidal thoughts (0.34), was not loaded onto the third “appetite/weight disturbance” factor. Notably, factor I to factor III were all composed of the items of the QIDS-SR16, and factor IV was all composed of the SSI pain-related items.
The confirmatory factor analysis was then performed with the second half of the sample to test the fit of this four-factor solution. Fit indices indicated a reasonably good fit of the four factor model: RMSEA=0.054; CFI=0.954; and TLI=0.947. All items also exhibited a factor loading (absolute value) of at least 0.3 (see Table 3). In addition, the oblique type of rotation among the four factors obtained a factor inter-correlation matrix, in which all four factors were significantly correlated with one another, ranging from 0.26 (mood/cognitive with pain) to 0.54 (mood/cognitive with sleep disturbance).
A second-order CFA with the four-factor solution was also performed to examine the relationship of each factor (first-order factors) with an overall second-order factor of “depressive symptoms”. Again, fit indices indicated a reasonably good fit: RMSEA=0.054; CFI=0.953; and TLI=0.946. Notably, these analyses were repeated with the data collected at each visit, and all confirmed a good fit of the four-factor solution, regardless of the addition of the second-order factor.
Fig. (2) graphically presents the relationship between the first-order factors (i.e., mood/cognitive, sleep disturbance, appetite/weight disturbance, and pain) and the second-order factor. The loadings of the first-order factors on the second-order factor indicated that each specific factor was significantly associated with the overall second-order factor. Although the pain factor was most weakly associated with the overall factor, the association appeared to be still significant and important with a loading of 0.43. The other first-order factors exhibited stronger associations with the overall factor (factor loadings: 0.78 for sleep disturbance, 0.68 for mood, and 0.60 for appetite/weight disturbance). Notably, their squared values, which indicate a proportion of the variance in each factor explained by the second-order factor, ranged from 18.1% (pain) to 61.3% (sleep disturbance).
Correlation between Factors and Outcomes
Table 4 shows the levels of correlation between the score of each factor (i.e., mood/cognitive, sleep disturbance, appetite/weight disturbance, and pain) and the score of each outcome measure (symptom severity [i.e. CGI-> scores] and quality of life [EQ-es]) both at baseline and at 24 weeks. All factors including the pain factor were positively correlated to depression severity and negatively correlated to the level of quality of life both at baseline and at 24 weeks (p<0.001 for all correlations).
The mood/cognitive factor was most strongly correlated to all types of outcomes measured both at baseline and at 24 weeks, followed by the sleep disturbance factor. In general, all factors exhibited stronger correlations at 24 weeks than at baseline, especially pain and sleep disturbance. At 24 weeks, the level of correlation with the pain factor was generally greater than that with the appetite/weight disturbance factor, and similar to that with the sleep disturbance factor. For example, the mood factor was still most strongly correlated to EQ-5D scores with a correlation coefficient of -0.654, followed by pain (-0.557), sleep disturbance (-0.484), and appetite/weight disturbance (-0.264). Notably, the pain factor was also significantly correlated to both CGI-S scores and QIDS-SR16 scores with correlation coefficients of 0.559 and 0.411, respectively.
DISCUSSION
This paper describes a preliminary investigation into whether painful physical symptoms could be considered within the spectrum of depressive symptoms, using a factor analysis on the combined items of the QIDS-SR16 and the SSI (pain-related items only). Both explanatory and confirmatory factor analyses suggested and validated a four-factor solution and that this factor structure included a factor that solely consisted of pain-related items (i.e. a pain factor). The other three factors identified were labelled (1) a mood/cognitive factor, (2) a sleep disturbance factor, and (3) an appetite/weight disturbance factor, respectively, according to the nature of the symptoms (i.e. items) included in each factor. The relevance of painful physical symptoms was also supported by the second-order factor analysis, showing an important and significant relationship between the pain factor and the overall factor of “depressive symptoms”. In addition, this pain factor was significantly correlated to depression severity and quality of life.
Painful Physical Symptoms within the Spectrum of Depressive Symptoms
The importance of somatic symptoms in depression has been well established in the literature, and partially reflected in diagnostic classification systems and rating scales for depression. However, painful physical symptoms have been rarely included in such rating scales, although they are one
of the most frequent complaints in patients with depression [20, 32], and are known to be associated with an unfavourable course of depression [33-35].
Notably, there has long been a concern over the inclusion of somatic symptoms, painful physical symptoms in particular, in the rating scales or in the diagnostic classification system. This is because patients with medical conditions can also report somatic symptoms for reasons other than depression, and therefore, the inclusion of these symptoms could lead to the overestimation of depression prevalence rates, that is, a high level of false positive diagnoses
Indeed, the exact mechanism behind the link between depression and pain has not been fully understood yet. For example, we do not know whether a causal relationship exists between the two and, if it exists, which condition is the cause. What we know or believe is that both conditions share a common biological pathway and an imbalance of serotonin and norepinephrine is likely involved in the pathophysiology of both conditions [32]. It is, therefore, reasonable to suspect the involvement of transmitter dysregulation, thereby a diagnosis of depression, when painful symptoms are not explained by organic pathologies. Given that psychiatric disorders are generally diagnosed solely based on symptom profiles, it is particularly important to identify a full spectrum of depressive symptoms, which will certainly help to better individualise treatment for patients with depression. In this light, our factor analytic findings suggest that painful physical symptoms could be considered another array of depressive symptoms, reinforcing the need for routine PPS assessment in patients with depression, especially given the high level of correlation between such symptoms and depression severity as well as quality of life. In addition, it may be reasonable to include painful physical symptoms in rating scales for depression, at least a subscale, although it requires a careful caution to avoid false positive diagnoses.
Fornaro et al. (2011): The fact that medically unexplained somatic complaints were essentially not associated with biopolarity is also a remarkable result since it was initially expected to be related to the “excitement” of mania. Rather, the total number of somatic symptoms (including both painful and non-painful somatic symptoms) was higher among those with a bipolar diagnosis. Painful physical symptoms could be less represented in “bipolar” MDEs than unipolar MDEs.
Other Factors: Mood/Cognitive, Sleep Disturbance, and Appetite/Weight Disturbance
The other three factors identified (i.e., mood/cognitive, sleep disturbance, and appetite/weight disturbance) were all internally consistent, appeared clinically plausible, and were largely similar to those identified in previous research.
Most factor analytic studies with patients with depression have proposed three to four factor models, regardless of a type of rating scale used, although there are some discrepancies in the type and number of items loaded onto the factors across the studies. For example, Rush et al. extracted a cognitive/mood factor, an anxiety/arousal factor, and a vegetative factor from each of the 30-item versions of IDS, Clinician-Reported (IDS-C30) and Self-Report (IDS-SR30) [12]. Craighead and Evans proposed a four-factor solution that consisted of cognitive-pessimism, affective, cognitive-anxiety, and vegetative factors, using the MADRS [17]. Similarly, Pancheri et al. also proposed a four-factor model that comprised a pure depressive dimension, a psychic anxiety dimension, somatic anxiety/somatisation, and an anorexia factor, using the HRSD-17 [15]. With the Zung self-rated depression scale, Romera et al. also identified a core depressive factor, a cognitive factor, an anxiety factor, and a somatic factor [18].
Despite the use of different labels, these studies have all identified a mood/cognitive factor, as in our study. This factor was composed of nine items in our study, including feeling sad, poor concentration/decision-making, self-criticism and blame, suicidal thoughts, lack of interest in people/activities, energy/fatigability, psychomotor retardation, and psychomotor agitation. Similar items were also included in the mood/cognitive factor identified from the IDS-C30 and IDS-SR30 [12], which have greater content coverage, compared to its shorter version, the QIDS-SR16, used in our study. However, the items, appetite disturbance and weight change, were included this mood/cognitive factor in the analysis with the IDS-SR30, while they were included in another factor in our study as well as in the analysis with the IDS-C30. Consequently, the items included in the other two factors identified in our study (i.e., sleep disturbance and appetite/weight disturbance) were also more consistent with those included in the other two factors (i.e., anxiety/arousal and vegetative) of the IDS-C30 factor structure. Specifically, the anxiety/arousal factor included insomnia-related items (i.e., initial insomnia and middle insomnia), as in our study (for the sleep disturbance factor), as well as anxiety-related items, most of which were excluded in the QIDS-SR16. Similarly, the vegetative factor included appetite disturbance and weight change, as in our study (for the appetite/weight disturbance factor), with some sleep problems (e.g., sleeping too much and early morning awakening).
However, it may not be surprising to observe some discrepancies in the results of factor analytic studies because the profile of depressive symptoms is also likely to differ across different populations [36, 37]. Notably, our sample is geographically diverse, but mostly from the non-Western world (East Asia, Mexico, and the Middle East). Further research is required to validate our findings in different populations and regions.
LIMITATION
Our results should need to be interpreted in the context of the following study limitations. First, given that painful physical symptoms are rarely included in widely used rating scales for depression, we combined two different measures—the QIDS-SR16 and the SSI—to extract a factor structure of the combined items and to confirm whether pain constitutes the factor structure as an independent factor. Although we successfully identified the pain factor, it was solely composed of the seven pain-related items of the SSI. Thus, we cannot exclude the possibility that the identification of the pain factor could be a statistical artefact, driven by a series of pain-related items taken from a different measure. Nevertheless, the Spearman’s correlation confirmed significant associations between the pain factor and depression severity, as well as quality of life. The correlation levels were generally greater than those with the appetite/weight disturbance factor and similar to those with the sleep disturbance factor at follow-up visits. Although these findings certainly indicate that painful physical symptoms have implications for treatment outcomes, further research is still warranted to confirm the validity of the pain factor. Second, our study sample was taken from a psychiatric care setting of patients who had been diagnosed with major depression. Many primary care patients presenting with painful physical complaints have not received a diagnosis of depression; therefore, our results could have been different if we had included primary care patients with unexplained painful physical symptoms. Third, our study included patients from different regions of the world. It has been speculated that culture and ethnicity may influence somatic and psychiatric presentation of depression [38, 39]. We, however, did not conduct subgroup analyses by region because our sample was already divided into two subsamples; one for exploratory factor analysis and another for confirmatory factor analysis. Further research needs to test the validity of the pain factor in different cultures and ethnicities. Fourth, because the primary objective of this observational study was to assess the frequency of TESD in the treatment of MDD, the study included only those patients who were sexually active without sexual dysfunction at baseline. Sexual dysfunction has been reported to be two to three times more prevalent in patients with depression compared with the general population [40, 41], and thus our findings may not be immediately generalizable to patients with MDD as a whole. Finally, because there are no single representative EQ-5D tariffs or country-specific tariffs for all countries included, we applied the commonly used UK tariff to the EQ-5D data to calculate utility scores [30].
CONCLUSION
This study represents one of the first attempts to explicitly evaluate the relevance of painful physical symptoms in defining a broader spectrum of depressive symptoms, with a sample of patients treated for MDD in psychiatric care settings in the non-Western world. A factor analysis on the combined items of the QIDS-SR16 and the SSI (pain-related items) identified a pain factor in addition to a mood/cognitive factor, a sleep disturbance factor, and an appetite/weight disturbance factor. This pain factor was also significantly associated with the second-order factor of the overall depressive symptoms and highly correlated to depression severity and quality of life at each follow-up visit. These findings generally suggest that painful physical symptoms should be routinely assessed in patients with depression and may need to be included in rating scales, at least as a subscale. Nevertheless, this is only a preliminary investigation, and further factor analytic studies, preferably with more comprehensive data from one single measure, are warranted to strengthen the basis of the present findings.
CONFLICT OF INTEREST
Jihyung Hong is a consultant for Eli Lilly and Company. Diego Novick, William Montgomery, Héctor Dueñas, and Xiaomei Peng are employees of Eli Lilly and Company. Jaume Aguado conducted the statistical analysis under a contract between Fundació Sant Joan de Déu and Eli Lilly and Company. Josep Maria Haro has acted as a consultant, received grants, or acted as a speaker in activities sponsored by the following companies: Astra-Zeneca, Eli Lilly and Company, Glaxo-Smith-Kline, and Lundbeck.
ACKNOWLEDGEMENTS
This study was funded by Eli Lilly and Company.