All published articles of this journal are available on ScienceDirect.

A Short Version of the Revised ‘Experience of Close Relationships Questionnaire’: Investigating Non-Clinical and Clinical Samples
Abstract
Aim:
This study seeks to investigate the psychometric properties of the short version of the revised ‘Experience of Close Relationships’ questionnaire, comparing non-clinical and clinical samples.
Methods:
In total 702 subjects participated in this study, of whom 531 were non-clinical participants and 171 were psychiatric patients. They completed the short version of the revised ‘Experience of Close Relationships’ questionnaire (ECR-R-18), the Perceived Stress Scale-10(PSS-10), the Rosenberg Self-Esteem Scale (RSES) and the UCLA Loneliness scale. A retest of the ECR-R-18 was then performed at four-week intervals. Then, confirmatory factor analyses were performed to test the validity of the new scale.
Results:
The ECR-R-18 showed a fair to good internal consistency (α 0.77 to 0.87) for both samples, and the test-retest reliability was found to be satisfactory (ICC = 0.75). The anxiety sub-scale demonstrated concurrent validity with PSS-10 and RSES, while the avoidance sub-scale showed concurrent validity with the UCLA Loneliness Scale. Confirmatory factor analysis using method factors yielded two factors with an acceptable model fit for both groups. An invariance test revealed that the ECR-R-18 when used on the clinical group differed from when used with the non-clinical group.
Conclusions:
The ECR-R-18 questionnaire revealed an overall better level of fit than the original 36 item questionnaire, indicating its suitability for use with a broader group of samples, including clinical samples. The reliability of the ECR-R- 18 might be increased if a modified scoring system is used and if our suggestions with regard to future studies are followed up.
INTRODUCTION
The amount of research into adult attachment has grown exponentially over the past 25 years, and the issue of adult attachment has become increasingly important in medical research, since attachment impacts individuals on a variety of levels, such as personality, coping styles, relationships and health, plus is a predisposing factor for a variety of symptoms such as anxiety, depression and personality disorders, and acts as a working alliance in psychotherapy [1-9]. A number of adult attachment measures have been developed, whether clinician-administered or self-reporting, and a recent review of adult attachment measures showed that at least seven interview methods and 22 self-report questionnaires have been used [10].
The Experiences of Close Relationships (ECR) measure is one of the self-report measures used widely in clinical settings, with clinical samples. The ECR, a 36-item questionnaire based on two dimensions: anxiety and avoidance, was developed by Brennan, Clark et al. [11], and later the original 323-item dataset was re-analyzed by Fraley [12] using item response theory. The self-report ECR is said to be meaningfully related to personality and psychopathology, and can be usefully applied on psychiatric populations [12]. The revised version (ECR-R) contains 18 items which assess romantic attachment anxiety and 18 items which assess attachment avoidance. Item answers form a 7-point Likert-type rating scale, ranging from 1 (disagree strongly) to 7 (agree strongly).
Scores on the anxiety and avoidance scales can still be used to classify people into the four adult attachment styles as developed by Bartholomew and Horowitz [13-15], based on thoughts about oneself (anxiety dimension) and about others (avoidant dimension). The anxiety and avoidance combinations create four attachment styles, these being: secure (low anxiety, low avoidance), preoccupied (high anxiety, low avoidance), fearful (high anxiety, high avoidance) and dismissing (low anxiety, high avoidance).
The ECR-R has been tested for its psychometric properties and found to have an adequate model fit with an Anglo-Saxon sample, plus to be acceptable for non Anglo-Saxon populations [16-19]. Wongpakaran et al. [20] have used a Thai version to test for reliability and validity, and produced the same result; however, it has been suggested that some items contributing to the slight areas of misfit in the model should be deleted in the 36-item version.
Although the ECR appears to be a highly reliable and a valid instrument to use when assessing adult attachment, it has mostly been used with non-clinical samples. When it comes to clinical samples, especially psychiatric patients, such a long questionnaire might easily have an adverse effect upon reliability; therefore, a shorter version needs to be developed. Recently, Wei et al. [21] developed a briefer version of ECR based on the original; the shorter version is comprised of twelve items and has been found to be a valid and reliable when compared to the original ECR; however, a later version of ECR-R - with some items different from the original - has never been developed in a shorter form. In addition, based on our previous study, it has been suggested that some items should be revised or deleted entirely [20]; therefore, the purpose of this study is to seek to revise the Thai version of the ECR-R into a shorter form, while attempting to maintain its construct validity. Exploratory factor analysis was used to determine appropriate items, and later confirmatory analysis methods were used to ensure the validity of the new version of the scale. Criterion validity was examined by finding the correlation between the ECR-R-18 and other self-report measures, such as Rosenberg’s self-esteem scale (RSES) [22], the Perceived Stress Scale [23], and the UCLA Loneliness Scale [24]. We hypothesized that the anxiety sub-scale would be positively correlated with the Perceived Stress Scale, and negatively correlated with the Self-Esteem Scale, whereas attachment avoidance was expected to have a positive correlation with the Loneliness Scale. As far as we are concerned, this study is the first developed to investigate the effectiveness of the shorter version of the ECR-R, as well as the first to compare its effectiveness with both clinical and non-clinical samples.
METHODS
This study project was approved by the Ethics Committee at the Faculty of Medicine, Chiang Mai University. According to Comrey, five to ten times the number of items is deemed to be a suitable sample size to carry out confirmatory factor analysis [25]; therefore, a convenience sample of 531 for non-clinical and 171 for clinical samples was determined to be appropriate for this study.
SUBJECTS
A non-clinical sample of 531 people was recruited from the relatives of those accompanying patients, plus from a group of undergraduate students, and hospital personnel. They were invited to participate in the study, and offered a participant information sheet (PIS) and informed consent form by a research assistant, plus were provided with a pack containing the PIS, questionnaires and an informed consent form. The process was carried out on a voluntary basis. No compensation was given to members of the group for their participation, among whom 58% were female aged 18 to 58 years old (M= 39.56 years, SD=8.05 years).
In the clinical sample, we recruited 171 patients from Maharaj Nakorn Chiang Mai Hospital Psychiatry Outpatients Service. The clinically stable patients were invited to participate in the study, were offered a PIS and informed consent form by a research assistant. The informed consent form covered the initial testing and four-week retesting activities. The inclusion criteria were 1) at least 18 years old, and 2) to be able to complete questionnaires. Potential participants were excluded if they revealed: 1) active psychosis 2) present episode of bipolar, manic episodes or severe depression, 3) organic mental disorders, 4) active conditions that required medical attention regardless of the cause; for example, active suicidal behavior, being delirious, intoxicated or withdrawn, and 5) any condition that required hospitalization. Among the recruited patients, 60% were female, aged 18 to 74 years old (M= 42.11 years, SD=16.08 years). According to the DSM-IV-TR, 39% suffered from depressive disorders, 10% had problems with substance abuse/dependence, and the rest suffered from anxiety disorders, somatoform disorders and psychosomatic disorders. Regarding re-testing, it was found that 86% of all participants performed the second round of questions for accuracy.
INSTRUMENTS
Thai Version of the Revised ‘Experience in Close Relationships’ Questionnaire (ECR-R-18)
The Thai version of the ECR-R was translated from the original English version - ECR-R [20]. The ECR-R-18 is a 36-item, self-report instrument which indicates levels of adult romantic attachment. The ECR-R has two dimensions: anxiety and avoidance. Nine items assess the anxiety sub-scale and nine items assess the avoidance sub-scale. In this study, respondents were measured using a 7-point scale that ranged from 1 ‘strongly disagree’ to 7 ‘strongly agree’, such that higher scores were associated with higher levels of anxiety or avoidance.
Rosenberg Self-Esteem Scale (RSES)
The Rosenberg Self-Esteem Scale was also utilized to examine concurrent validity. This is a ten item questionnaire, which uses a 4-point Likert scale with answers ranging from ‘strongly agree’ to ‘strongly disagree’. Higher scores are associated with higher levels of self-esteem; for example, ‘I take a positive attitude towards myself’. This measurement has been validated and found to demonstrate an acceptable level of reliability and validity [22]. For this study sample, the Thai RSES revealed a good internal consistency (α=0.87).
Perceived Stress Scale-10 (PSS-10)
PSS-10 is a well-known stress instrument that measures the degree to which life events are perceived as being stressful. It’s a 5-point Likert scale instrument, with the scale ranging from 0 to 4. It asks respondents how often they have felt or thought in a particular way within the previous month, with a higher score reflecting a greater perception of stress; for example, ‘In the last month, how often have you been upset because of something that happened unexpectedly?’ The Thai version of PSS-10 has demonstrated good internal consistency, construct validity and concurrent validity with other measurements (overall α=0.85) [23].
UCLA Loneliness Scale
In this study, this was utilized to examine concurrent validity with the avoidance sub-scale. The UCLA Loneliness Scale, as developed by Russell et al., is a uni-dimensional measurement of people’s perception of loneliness. It consists of a 20-item questionnaire, and uses a 4-point Likert scale with answers ranging from ’strongly agree’ to ‘strongly disagree’. Higher scores are associated with greater feelings of loneliness such as; for example, ‘There’s no one I can turn to’. The Thai version has been validated and found to demonstrate an acceptable reliability (α=0.80) and concurrent validity with respect to the Thai depression inventory and the Multi-dimensional Scale of Perceived Social Support (MSPSS) [24].
Statistical Analyses
Descriptive statistics were used for data screening and found to be acceptable (Cronbach’s α > 0.6)), and all items revealed skewness and kurtosis <±2) [26]. Missing values were managed by replacing them with the series’ mean. Data screening was conducted for exploratory factor analysis (EFA) purposes and the sampling adequacy was found to be good, with Kaiser-Meyer-Olkin (KMO) values of more than 0.8 for both groups. Bartlett’s test of sphericity was significant in both samples (p < .001) [27]. The maximum likelihood method, with oblique rotation, was performed on the items, and for confirmatory factor analysis, the following model fit indices were used: (i) the Comparative Fit Index (CFI) ≥ 0.95, (ii) the Tucker-Lewis Index (TLI) ≥ 0.9, (iii) the root-mean-square error of approximation (RMSEA) ≤ 0.6, (iv) the standardized root-mean-square residual (SRMR) ≤ 0.08 [28-30], and (v) a modification indices. In addition, an invariance test was applied to see whether those items comprised within a particular measuring instrument operated equivalently across different populations.
Finally, internal consistency reliability was determined through calculation of the Cronbach α coefficient, with a reliability of more than 0.70 deemed acceptable [31]. Factor analysis was carried out using the SPSS AMOS package version 18 [32].
RESULTS
Item Selection
In accordance with our previous study, items producing model misfits included Items 12 and 3 (which gave large standardized residuals leading to item sharing). Items 5, 9 and 23 on the anxiety side and Items 11, 13, 17 and 24 on the avoidance side (low R2 values); Items 2, 3, 11, 17 and 24 (double-loading) and Item 12 (extraneous content), and were thus excluded. In addition to these items, those with low R2 and factor loadings were excluded for both sub-scales. Nine items were finally left for each sub-scale, leaving a new set of 18-item questionnaires. The new scale was re-analyzed and yielded an excellent model fit, as follows: CFI = 0.99, TLI= 0.99, RMSEA = 0.014 and SRMR = 0.03. (For details see Wongpakaran et al. [20]).
Descriptive Statistics
The mean and standard deviations for the anxiety and avoidance scores of both groups were: 3.01±1.07, 2.90±0.82 for the non-clinical group, and 3.70±1.58, 3.50±1.11 for the clinical group (Table 1). There was a significant difference in the levels of anxiety and avoidance between both groups (t= 6.59, p < .001; t = 7.01, p <. 001 respectively), but there were no gender differences revealed for either group. When anxiety and avoidance scores were matched to an attachment style, the secure style scored 70.1%, the preoccupied style 19.4%, the fearful style 2.4% and the dismissing style 8.1% for the non-clinical group, whilst the secure style scored 40.4%, the preoccupied style 28.7%, the fearful style 12.9%, and the dismissing style 18.1% for the patient group. A Fisher Exact Chi-square test was performed to test the difference in attachment styles between the two groups and was found to be significant (p <. 001)(Fig. 1).
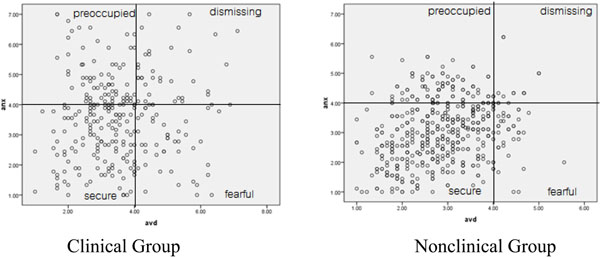
Comparison of Attachment Styles using ECR-R-18 between the Clinical and Nonclinical Groups.
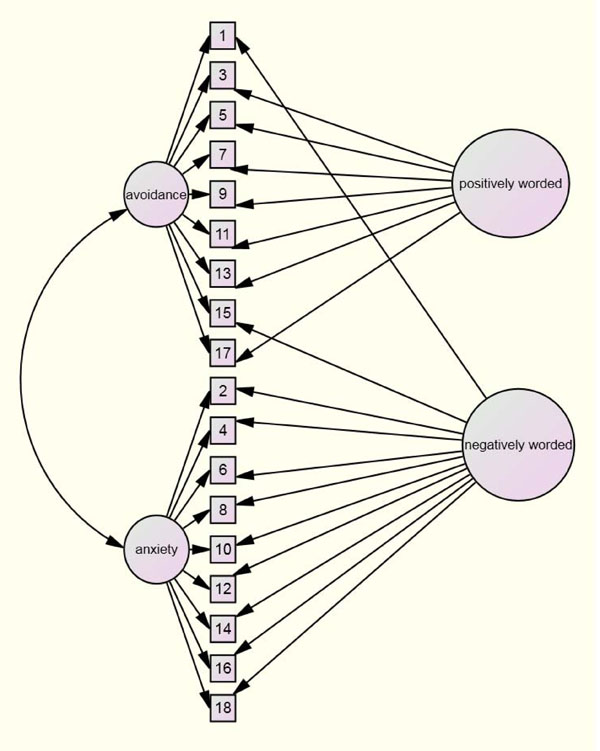
ECR-R-18 with Method Factors (Positively and Negatively Worded).
Comparison of Descriptive Statistics and Factor Analysis Findings (for the ECR-R-18) between the Nonclinical and Clinical Groups
| Items | Factor I (Anxiety) | Factor II (Avoidance) | Communality (h2) | |||
|---|---|---|---|---|---|---|
| Nonclinical | Clinical | Nonclinical | Clinical | Nonclinical | Clinical | |
| 8. I often worry that my partner will not want to stay with me. | .775 | .754 | .609 | .603 | ||
| 12. When I show my feelings for romantic partners, I'm afraid they will not feel the same about me | .704 | .707 | .563 | .500 | ||
| 16. I worry that romantic partners won’t care about me as much as I care about them. | .690 | .768 | .468 | .611 | ||
| 4 When my partner is out of sight, I worry that he or she might become interested in someone else. | .721 | .758 | .522 | .590 | ||
| 2. I often worry that my partner doesn't really love me. | .684 | .752 | .474 | .608 | ||
| 18 I worry that I won't measure up to other people. | .671 | .626 | .451 | .392 | ||
| 14. Sometimes romantic partners change their feelings about me for no apparent reason. | .575 | .693 | .334 | .486 | ||
| 6. My romantic partner makes me doubt myself. | .602 | .732 | .370 | .598 | ||
| 10. I worry a lot about my relationships. | .585 | .673 | .360 | .469 | ||
| 7. I usually discuss my problems and concerns with my partner. | .786 | .729 | .622 | .552 | ||
| 11. I tell my partner just about everything. | .767 | .721 | .589 | .547 | ||
| 3. I feel comfortable sharing my private thoughts and feelings with my partner. | .716 | .560 | .515 | .337 | ||
| 5. I find it relatively easy to get close to my partner. | .665 | .608 | .443 | .408 | ||
| 17. It helps to turn to my romantic partner in times of need. | .632 | .673 | .427 | .457 | ||
| 9. I find it easy to depend on romantic partners. | .546 | .637 | .335 | .434 | ||
| 13. It's not difficult for me to get close to my partner. | .526 | .449 | .306 | .239 | ||
| 15. I talk things over with my partner. | .570 | .356 | .336 | .388 | ||
| 1. I prefer not to show a partner how I feel deep down. | .422 | .086* | .227 | .291 | ||
| Eigenvalue | 5.04 | 5.38 | 2.93 | 3.13 | ||
| %variance | 28.01 | 29.93 | 16.27 | 17.36 | ||
| M | 3.01 | 3.70 | 2.90 | 3.50 | ||
| SD | 1.07 | 1.58 | 0.82 | 1.11 | ||
| Cronbach's alpha | 0.85 | 0.89 | 0.81 | 0.73 | ||
* Item 1 has a high loading on Factor I (anxiety) (0.533)
Comparison of the Fit Indexes of Two-Factor Confirmatory Models for the Nonclinical and Clinical Groups
| Good Fit Indices | Bad Fit Indices | |||||||
|---|---|---|---|---|---|---|---|---|
| Absolute | Comparative | Parsimonious | ||||||
| Sample | Model | χ2 | df | TLI | CFI | AGFI | RMSEA (90%CI) | SRMR |
| Nonclinicala | 2-factor | 585.16 | 134 | 0.83 | 0.85 | 0.86 | 0.080(0.073-0.086) | 0.067 |
| 2-factor+ MF | 369.75 | 116 | 0.90 | 0.92 | 0.90 | 0.059(0.052-0.067) | 0.059 | |
| Clinicalb | 2-factor | 330.698 | 134 | 0.80 | 0.82 | 0.77 | 0.093(0.080-0.106) | 0.074 |
| 2-factor+ MF | 181.669 | 115 | 0.92 | 0.94 | 0.85 | 0.058(0.042-0.074) | 0.050 | |
Note: TLI = Tucker-Lewis Index, CFI = comparative fit index, AGFI = Adjust Goodness-of-Fit Index, RMSEA = root mean square error of approximation and SRMR = standardized root-mean-square residual
MF = Method Factors in the ’negatively worded’ factor group, Items 1, 2, 4, 6, 8, 10, 12, 14, 15, 16 and 18, were parcelled, whereas Items 3, 5, 7, 9, 11, 13 and 17 were grouped into the ‘positively worded’ factor group.
a N =531;
b N=171
Correlations between the sub-scales of ECR-R-18 and the PSS-10, RSES and UCLA Loneliness Scales (N=171)
Notes:
** Correlation is significant to a 0.01 level (two-tailed)
* Correlation is significant to a 0.05 level (two-tailed)
Exploratory Factor Analysis
Factor analysis, using an un-rotated maximum likelihood method found that four components explained 53.56% of the variance (Eigenvalues > 1) and 41.61% of the variance was accounted for by two components in the student group; whereas four components explained 57.58% of the variance, and 44.85% of the variance was caused by two components for the patient group. Although four factors were extracted, a sharp decreasing trend after the second factor could be seen using a scree plot (not shown here), suggesting a tendency to favor a two-factor model. The results were similar for both samples.
A second maximum likelihood analysis - forcing two factors with an oblique rotation (delta=0), plus a Kaiser Normalization, were performed, resulting in all items being loaded on to the designated scales except for Item 1 in the patient group, which appeared to be cross-loading. The loadings ranged from 0.461 to 0.707 for the anxiety sub-scale and 0.461 to 0.707 for the avoidance sub-scale with the non-patient group; and from 0.297 to 0.679 for the anxiety sub-scale and 0.582 to 0.723 for the avoidance sub-scale for the patient group. Item 1 had the lowest factor loading in the samples; Items 13 and 15 were second and third lowest (See Table 1). In fact, Item 15 was loaded on to the third factor from the initial analysis, while Items 1 and 13 were found to be negatively worded (Table 2).
Confirmatory Factor Analysis
Based on our investigation of the sensitivity of various fit indices, the following absolute fit indices were used to identify the model misspecification: the Comparative Fit Index (CFI), the root mean square error of approximation (RMSEA) scale and the standardized root mean square residual (SRMR) scale. Chi-square statistics were used to evaluate the difference between the sample covariance matrix and the implied covariance matrix from the hypothesized model [31].
As suggested by Hu & Bentler [28, 29, 33], a Comparative Fit Index (CFI) score of ≥ 0.95, a TLI(NFI) of ≥ 0.9, a root-mean-square error of approximation (RMSEA) of ≤ 0.6 and a standardized root-mean-square residual (SRMR) of ≤ 0.08, are indicative of a good fit. Our results demonstrated that the two-factor model for the ECR-R-18 demonstrated a poor fit (χ2 = 585.16, df =134, CFI = 0.85, AGFI = 0.86, TLI = 0.83, RMSEA= 0.080 and SRMR = 0.067 for the non-clinical group, and χ2=265.00, df = 134, CFI = 0.89, AGFI = 0.85, TLI = 0.87, RMSEA = 0.065, and SRMR = 0.074 for the patient group).
As found in Wei’s study, a poor fit influences the production of systematic errors that might be due to the items’ wording style, that is, participants may have a systematic way of responding to negatively and positively worded items, regardless of the content of the item. Therefore, method factors, where two orthogonal factors that corresponded to a negatively or positively worded item, were employed here (Fig. 2).
The method effect was utilized by parceling eleven negatively worded and seven positively worded items. The negatively worded items included Items 1, 2, 4,6, 8,10, 12, 14,15, 16 and 18; whereas the positively worded items included Items 3, 5, 7, 9, 11, 13 and 17 (shown in Fig. 2). The results reveal that: the χ2 was reduced to 369.75, df = 116, TLI = 0.90, CFI = 0.92, AGFI = 0.90, RMSEA = 0.059 (90%CI, 0.052, 0.067) and SRMR = 0.059 in the non-clinical group, and: χ2 = 3181.67, df = 115, TLI = 0.92, CFI = 0.94, AGFI = 0.85, RMSEA = 0.058 (90%CI, 0.042, 0.074), and SRMR = 0.050 in the patient group, indicating an acceptable level of fit for the model (Table 2).
Measurement Invariance across Groups and Gender
Multi-group analysis was conducted to compare an unconstrained model (where factor loadings, error variances and factor correlations were free to vary across the patient and non-clinical groups), with a constrained version, one that fixed the factor loadings and error variances to be equal across the two samples. If the fully constrained and unconstrained models were significantly different, follow-up analyses were conducted using a partially constrained model (that is, fixed factor loadings but unfixed error terms) to determine the degree of model stability across each sample.
Invariance across Groups:
The fully unconstrained (χ2 = 556.17, df = 202, p <.001) and fully constrained (χ2 =1456.62, df =274, p <.001) models were significantly different to each other (χ2 =900.45, df =68, p <.001), suggesting that measurement parameters were not equivalent across the patient and non-patient groups.
Invariance across Genders:
The fully unconstrained (χ2 = 334.124, df= 252, p <.001) and fully constrained (χ2 = 381.181, df = 289, p <.001) models did not differ significantly (χ2 = 47.057, df =37, p =.124), suggesting that the measurement parameters were not significantly different across genders.
Concurrent Validity
The results for concurrent validity were as expected. The anxiety sub-scale correlated positively with the PSS and UCLA scales (r = 0.458, p < .01 and r = 0.403, p <. 01 respectively), but correlated negatively with the RSES scale (r = - 0.363, p <.01). Similarly, the avoidance sub-scale correlated positively with the UCLA scale (r = - 0.154, p <. 05), but did not reveal any relationship with the RSES and PSS scales (Table 3).
Reliability
For reliability, we found that ECR-R-18 had a fair to good level of internal consistency (α = 0.84 for the non-clinical group and 0.75 for the patient group). The internal consistency of the anxiety scale appeared to be higher than that of the avoidance sub-scale in both groups (see Table 1), and in terms of the test-retest correlation for the ECR-R-18, the intra-class correlation coefficient yielded a score of 0.75 (95% CI: 0.63 to 0.80) for the scale.
DISCUSSION
In terms of descriptive data, there was a clear distinction between the data provided by the two samples. As expected, the patient group appeared to have a higher level of insecure attachment (e.g., preoccupied, fearful and dismissing) than the non-patient group. A further important point was whether the measurement construct was the same between the two groups, and the results shows that it was not. Item 1 (‘I prefer not to show a partner how I feel deep down’) was found to be problematic and seemed to be responsible for the discrepancy since it loads on the other factors in the patient sample. This item was also found to be double-loading in Wei’s study and was not thus chosen for the short ECR [21].
Overall, Cronbach’s alpha was acceptable for both groups but was lower in the clinical group (0.84 for the non-clinical sample; 0.77 for the clinical sample), and was lower in the avoidance sub-scale than in the anxiety scale, especially in the patient group. Notably, most items on the avoidance sub-scale were negatively worded, indicating that the responses were more sensitive to negatively worded questions, especially items containing ‘not’ in the sentence. This is supported by Colosi [34] who found that negative phrases or sentences in questions bring about inconsistency in terms of responses, including a higher frequency of ’don’t know’ responses, and that this impacts more upon clinical than non-clinical groups. The fact that the ECR-R-18 did not achieve an excellent model fit is because there was a high proportion of negatively worded items when compared to positively worded items (11 to 7), giving a greater chance of a low reliability. In general circumstances, negatively worded items can give lower reliability [35-37] but the situation could be worse for a clinical sample, as there may be interference from transient or pseudo-cognitive impairments related to high anxiety or poor concentration, and this may limit rating at that moment when compared to a non-clinical sample. The fact that in this study Item 1 was found to have the lowest quality might be because it is a question for which respondents are not yet aware of its true meaning. All in all, the concept of creating negatively worded items for fear of an acquiescent response bias might be cautiously applied to this sample. Modifications to this item, such as changing it from negative to positive wording and having the revised version tested on a separate sample, should be carried out before using it with clinical patients, plus if ECR-18 is to be used with a clinical sample, we also suggest dropping Item 1 from the calculation of the avoidance score (take the sum of 8 items and divide it by 8 to give the mean of the avoidance score).
In terms of factor structure, this shorter version of ECR-R was generally better than the original one in terms of model fit; ECR-R-18 yielded acceptable fit indices as all of the scores were more than 0.90, except for AGFI. This may not meet the perfect criteria of Hu and Bentler, but was generally an acceptable fit. In terms of the bad fit indices, ECR-R-18 demonstrated a good model fit here also, and overall it was comparable or slightly better than the original 36-question ECR-R (Thai version) (CFI = 0.95, NFI = 0.81, RMSEA = 0.04 and SRMR = 0.10) [20].
Measurement invariance tests showed that both constructs were significantly different, indicating that this measurement, when tested on a non-clinical sample cannot be simply used for a clinical sample and employ similar interpretations. These results suggest that alternative scoring methods may need to be considered when using ECR-R-18 data, otherwise some items should be modified, since the measurements that contain negatively worded items not only harm the reliability but also the predictive validity of the measurements [38].
As expected, the anxiety scale showed a significant, negative correlation with the perceived stress scale and the self-esteem scale, whilst avoidance was found to have a positive correlation with the loneliness score highlighting its concurrent validity. The test-retest reliability of ECR-R-18 was also acceptable, indicating its stability over time in this type of group.
ACKNOWLEDGEMENTS
TW designed the study; collected and analyzed the data and wrote the paper. NW co-designed the study, collected the data and helped to write the paper. This research was part of the project: ‘A Comparison of Feedback on Psychotherapy Outcomes’ funded by the Faculty of Medicine, Chiang Mai University in the Kingdom of Thailand.
LIMITATIONS AND FURTHER RESEARCH
One limitation of this study is that no measurement invariance was found across the different type of participants; therefore, ongoing evaluations of this shorter version of the ECR-R will be important, as this is the first study to use a clinical sample. It should also be noted that some items with a negative bias need to be revised, in order for the measurement to be used in a clinical setting. The testing of a new scale containing some items transformed from a negative into a positive style is encouraged for future research, as evidence has shown that this kind of method gives a better model fit [35]. Thus, there should be a replication of the design using modified sub-scales for this population. In addition, cultural differences might play a role in generating different results for Western and Asian populations, particularly when it comes to relationship matters. We therefore propose that the shorter version, either ECR-R-18 or ECR-S, be examined in other cultural contexts.
In summary, this study provides a first evaluation of the shorter version of the ECR-R, using CFA, as applied to both non-clinical and clinical samples. Additional research is required to determine if the results obtained in this study can be replicated in other settings.