All published articles of this journal are available on ScienceDirect.

Modelling Needs for Mental Healthcare from Epidemiological Surveys with Validation Using Sociodemographic Census Data
Abstract
Purpose: To develop and validate a prediction model for mental health needs (MHN) and psychiatric needs (PN) using specific social indicators, obtainable from census data, within low-density departments (LDD) and high- density departments (HDD). Methods: In a population-based study of 20,404 participants from 22 departments in France, mental health needs were defined into three categories (no needs, MHN, and PN) using the Composite International Diagnosis Interview Short-Form, Sheehan disability scale, and presence of depressive and alcohol disorders. Within HDD (n=9) and LDD (n=13) departments, two separate logistic regression models, using MHN or PN as an endpoint, were fitted using available sociodemographic data. Model validation was performed using 2007 census data. Overall accuracy was evaluated using average residuals (AR) calculated within density stratum.
Results: In LDD and HDD respectively, 26.6% and 28.7% of persons had MHN and 9.8% and 11.3% had PN. In LDD, housing type, age, employment, living alone, housing support, and household size predicted MHN and PN. In HDD, housing type, living alone, household size, living in a marriage/partnership, and duration of dwelling habitation predicted MHN and PN. Predictions were more accurate in HDD, in which the AR was 30% lower for MHN and 40% lower for PN. Predictions were less accurate when using census data, yet they were consistently better in HDD.
Conclusions: Sociodemographic indicators from either survey or census data may be useful in predicting MHN and PN in high-density settings. The ideal territorial size still needs to be evaluated when planning psychiatric and mental health resources.
BACKGROUND
Mental health care resources have to be planned at the local or regional levels with the aim of reflecting the needs and specific characteristics of each area [1]. However, there are no consistently defined or validated models, from which mental health care needs can be accurately translated from socio-demographic characteristics [2, 3]. Easily implemented and validated data of this kind could help assess mental health needs in order to plan appropriate resource distribution at a national, regional, and local level [4, 5].
Numerous studies have correlated social deprivation indices with crude psychiatric admission rates, thus only predicting the need for institutionalized psychiatric resources [6]. However, only a small portion of people with severe psychiatric disorders are admitted to hospitals as most psychiatric care is performed in other settings, thus ignoring those who need outpatient care (i.e. those suffering from higher-prevalent mental illnesses) [7]. Furthermore, the rate of hospitalization can be greatly influenced by the lack of availability of outpatient care resources, such as community mental health services or the adequacy and availability of primary mental health care [5, 8].
In addition it is also important to consider the pathway to mental health disorders, such as those proposed by the National Health Services in the United Kingdom. General practitioners, with the assistance of counsellors, care for less severe disorders, while specialist are required to tend to more severe cases [9]. Indeed, the volume of patients requiring primary care largely outnumbers those requiring secondary care and, in parallel, the density of primary care physicians and non physicians is much larger than that of psychiatrists. These must be considered as to ensure a fair distribution of mental health care within resources [10].
The Colorado study was one of the first attempts to use epidemiological surveys to plan mental health care resources [11]. In this study, various levels of mental health and psychiatric needs were evaluated using epidemiological survey data, allowing the authors to develop a model based on socio-demographic data. They then employed it to diverse area levels, where such data are routinely available. However, although this study initiated an array of new resource-planning strategies, the authors did not quantitatively validate their model nor did they provide the extent of prediction variability, hence making it difficult to assess its applicability. Other population characteristics, namely population density, may also affect mental health and mental health service usage [12]. In addition, some studies [13] have reported that the correlation between social indicators and mental health may only be accurate in urban areas corresponding to high density population.
The aim of this study is then to create models using social variables in order to predict two levels of needs, corresponding to primary (“Mental Health Needs” MHN) and secondary care (“Psychiatric Needs” PN), based on data collected from a large population-based survey. We then wished to use these models to predict needs per specific areas by routinely-collected census data.In other words, we attempt to answer to the following questions: [1] are the types of MHN and PN linked to social variables at the individual level, [2] are they different for each type of needs, [3] is it possible to predict MHN and PN by using social indicators from population census for a territory and to validate these predictions using survey data, and [4] does population density (High/Low) affect the accuracy of predicting needs?
METHODS
Study Design
A telephone survey was conducted by a polling institute (Ipsos) dedicated to health surveys. For each of the four regions, a random list of telephone numbers was extracted from the publicly-available telephone directory. Both listed and unlisted numbers were then obtained by replacing the last digit by a randomly chosen number. This procedure resulted in the selection of 32,351 contacted households. Of these, 28,238 (87.3%) provided sufficient information to proceed to random selection of one potential participant. 5050 households could not be reached, either due to lack of reply after fifteen calls or because the respondent had a physical or mental disability. Among the 23,188 individuals who were contacted; 20,077 completed the full interview, corresponding to a participation rate of 86.6% and an overall response rate of 71.1%.
In order to extend sampling coverage to households with only mobile phones, we conducted a smaller, parallel survey using random digit dialling for all French departments. A list of these four-digit prefixes was obtained from the national authority overseeing telephone numbers. Then the other six digits were generated at random to complete the ten-digit number. Subjects were subsequently selected if they had a non-business mobile phone number and their household was not equipped with a landline phone. Among the 3698 subjects contacted, 2061 completed the full interview, corresponding to a participation rate of 55.7%. Of them, 327 were from the departments included in the original survey and were added to constitute an overall sample of 20,404 individuals.
One individual was selected per household and observations were weighted by the inverse of selection probability [14, 15]. Post-stratification weights were also used to standardize age, gender, and socio-economic status of the sample to the general population [16, 17]. The distribution of these variables was obtained by publicly-available, 2007 census data from the French National institute of Statistics [18].
Mental health status was determined by using the short-form of the Composite International Diagnosis Interview Short-Form (CIDI-SF) [19, 20], which has been compared to the full version with good results [21, 22]. A number of cross-national surveys have been reported in Europe using this instrument [23] in different languages including the French version used for this work [24, 25] and whose translation has been validated [26].
As in the WMH CIDI, the CIDI-SF provides twelve-month prevalence rates for major depressive disorder, most anxiety disorders (phobia, panic disorder, generalized anxiety disorder, obsessive compulsive disorder, and post-traumatic stress disorder), and substance use disorders defined according to the DSM - Revision IV (DSM-IV) classification. The Sheehan disability scale was also embedded in each diagnostic section with the purpose of evaluating impairment in four domains [27].
The needs for care were classified into three hierarchical and mutually exclusive categories: (1) PN requiring second line specialized services, (2) MHN requiring treatment within the primary system, and (3) no needs.
Subjects classified as PN were operationally defined as presenting a diagnostic from at least two classes of mental disorders (depressive, anxiety, or substance use disorders) or severely impaired due to any individual disorder (score of ≥7 on the Sheehan scale). Subjects classified as having MHN were defined as those presenting psychological distress, or only one mental disorder without any severe impairment (score of<7 on the Sheehan scale) or two diagnoses within the same class of disorder without severe impairment. The remaining subjects were classified as having no needs.
The latest available French population census data, dated 2007, were obtained from INSEE and pooled by department (“department”). They correspond to social determinants reported as correlated with services use [28]:
Demographics: gender, age, marital or cohabitating status, households occupied by couples, single parent households, single-person households
Education level (% of individuals aged over 18 years completing secondary education), occupation, employment status (employed, retired, unemployed).
Housing: ownership, number of rooms, subtype (individual, collective, other), comfort (WC, bathroom), calculated as the proportion of all households in the area.
Principal economic activity of the area: agriculture, industry, tertiary, construction
Statistical Methods
Preliminary analysis showed that there were substantial differences in needs in LD (≥200 habitants/km2) and HD (<200 habitants/km2) departments. Analysis was then also stratified on departmental density.
Each Socio-Demographic variable was placed in a logistic regression model to predict mental health and psychiatrist needs on an individual level. Individual predictions were averaged within each of the 22 individual departments. For each variable, residuals were calculated within department in which the observed % of needs was subtracted by the expected % of needs and then squared. The sum of all residuals was calculated. The first five Socio-Demographic variables with the lowest residual sum (i.e. closest overall departmental-level predictions) were then placed in a multivariable logistic regression model with the aim of preserving parsimony. Variables that did not add significant prediction to the model (p<0.20) were then eliminated in a stepwise, backward-selection procedure [29]. The resulting multivariate models were used to predict needs for each department.
A validation of our sample was then attempted using data available from the 2007 census conducted by INSEE. Departmental statistics were obtained on each of the Socio-Demographic variables, whereupon prediction of healthcare needs were calculated for each department based on the parameter estimates of the multivariable logistic regression model. All variables in the sample validation analyses were adapted to correspond to available INSEE data. Some variables used in the selection models are not reported in their original scales, rather in the scales of INSEE variables.
Finally, the accuracy of healthcare needs based on survey and INSEE data were evaluated on a departmental level. The difference between observed and expected values was calculated and the range of differences was reported. Average residuals were then created by squaring the difference, summing the squared differences within density strata, and dividing by the numbers of departments.
All analysis was performed using STATA statistical software package (v11.0, College Station, TX, USA).
RESULTS
13,849 participants resided in LD departments (<200 habitants/km2) and 6,555 in HD departments (≥200 habitants/km2) at the time of interview. Age distribution was significantly older in LD vs. HD areas (p<0.0001), with more participants at an age range of 65-79 years (14.9% vs. 11.8%, respectively) and slightly more participants at an age range of 55-64 years (13.8% vs. 12.5%, respectively). Retired persons were more likely to be found in LD regions (22.8 vs. 18.9% in HD departments, p<0.0001). Higher proportion of homeowners resided in LD (66.2%) compared to HD departments (51.6%, p<0.0001). Likewise, a higher proportion of persons living in LD, compared to HD departments, have been living in their residences for more than 5 years (89.7% vs. 79.3%, respectively p<0.0001). Albeit the mean number of persons per household was similar (3.0-3.1), LD departments had a lower percentage of persons living alone (15.5%) and a higher percentage of persons living in cohabitation or married (70.3%) compared to HD departments (p<0.0001) (Table 1).
Persons living in LD departments with government sponsored housing or private renters have a higher adjusted odd of MHN vs. home-owners (aOR=1.48, 95% CI: 1.29-1.71 or a OR=1.22; 95% CI: 1.07-1.38, respectively). Employment or retired status had a protective effect on MHN (aOR=0.64, 95% CI: 0.55-0.74 or a OR=0.58, 95% CI: 0.49-0.70, respectively) when compared to unemployed persons. Overall, age was a significant predictor of MHN, with higher adjusted odds among 40-54 year olds (aOR=1.19, 95% CI: 0.98-1.43) and slightly lower odds among persons 65-79 (aOR=0.97, 95% CI: 0.76-1.22) and ≥80 years old (aOR=0.95, 95% CI: 0.70-1.28) than 18-24 year olds. In LD, PN risk factors substantially differ from MHN except living in a government sponsored household or private renter, who had respective 1.77-fold (95% CI: 1.40-2.25) and 1.49-fold (95% CI: 1.23-1.80) increase in adjusted odds of PN than home-owners. Other significant factors of household description were: persons with government housing support (aOR=1.45, 95% CI: 1.17-1.81), persons not living alone (aOR=0.41; 95%CI: 0.34-0.51) and total number of persons per household (aOR per person=1.10, 95%CI: 1.02-1.19) (Table 2).
In HD areas, MHN predictors were: housing type (aOR for governmental sponsored housing=1.49, 95% CI: 1.24-1.77; aOR for private renter= 1.55, 95% CI: 1.32-1.82, vs. home-owners), household composition (aOR for adults not living alone=0.81, 95% CI: 0.67-0.99; aOR per number of person in household=1.06, 95% CI: 1.00-1.13), and marital or partnership status (aOR=0.65, 95% CI: 0.54-0.77). In HD departments predictors of PN were very similar to those of MHN: Housing type (aOR for governmental sponsored housing=2.54, 95% CI: 1.94-3.33; aOR for private renter= 2.05, 95% CI: 1.55-2.69, vs. home-owners), household composition (aOR for adults not living alone=0.74, 95% CI: 0.56-0.97), and marital or partnership status (aOR=0.60, 95% CI: 0.45-0.78). In addition, persons living in their current household for less than 5 years were at increased adjusted odds of PN (aOR=1.11, 95% CI: 0.86-1.43) (Table 3).
26.6% of LD and 28.7% of HD departments were having MHN (p=0.009). Percentage of MHN for each department are provided in Fig. (1a) for LD and Fig. (2a) for HD departments. PN were observed in 9.8% of LD and 11.3% of HD departments, (p=0.01). Percentage of PN for each department are provided in Fig. (1b) for LD and 2b for HD departments.
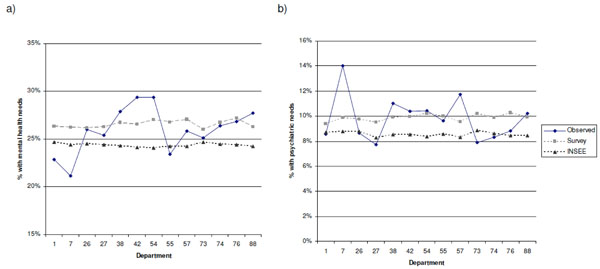
Mental health (a) and psychiatric (b) need prediction using survey and census data across low-density departments Predictions for mental health and psychiatric needs are reported for departments with a density <200 habitants/km2. Symbols from legend represent the following predictions: “observed”, values observed from the survey; “survey”, predicted values based on the algorithm using demographic data from the survey; or “INSEE”, predicted values using data from publicly available datasets, namely INSEE.
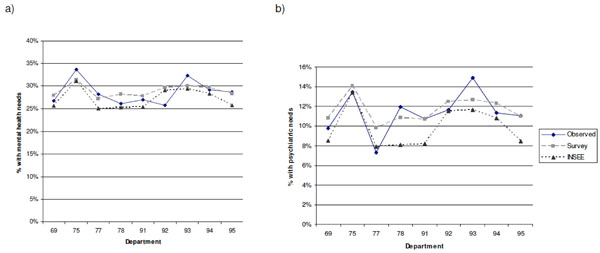
Mental health (a) and psychiatric (b) need prediction using survey and census data across high-density departments Predictions for mental health and psychiatric needs are reported for departments with a density ≥200 habitants/km2. Symbols from legend represent the following predictions: “observed”, values observed from the survey; “survey”, predicted values based on the algorithm using demographic data from the survey; or “INSEE”, predicted values using data from publicly available datasets, namely INSEE.
Description of demographic variables in the study population.
| %* within departments | |||
|---|---|---|---|
| Descriptor | Low-densityn=13,849 | High-densityn=6,555 | p** |
| Age in groups | <0.0001 | ||
| 18-24 | 12.1 | 13.4 | |
| 25-39 | 29.8 | 32.7 | |
| 40-54 | 26.6 | 26.6 | |
| 55-64 | 13.8 | 12.5 | |
| 65-79 | 14.9 | 11.8 | |
| ≥80 | 2.8 | 3.0 | |
| Employment Activity | |||
| Unemployed | 17.8 | 17.3 | 0.5 |
| Employed | 59.5 | 63.9 | <0.0001 |
| Retired | 22.8 | 18.9 | <0.0001 |
| Type of housing | <0.0001 | ||
| Home-owner | 66.2 | 51.6 | |
| Government sponsored housing | 13.0 | 20.8 | |
| Private renter | 15.9 | 21.9 | |
| Other | 5.0 | 5.7 | |
| Households occupied for ≤5 years | 10.3 | 20.7 | <0.0001 |
| Married or partnership status | 70.3 | 63.9 | <0.0001 |
| Households with only 1 adult | 15.5 | 22.9 | <0.0001 |
| Total number of persons per household, mean | 3.1 | 3.0 | ntp |
| Persons with governmental housing support | 15.4 | 15.1 | 0.7 |
Threshold to determine low- vs. high-density department was defined at 200 habitants/km².ntp=no test performed* All statistics are reported as percentages unless otherwise indicated. ** Density groups were compared using likelihood-ratio test statistic for proportions corrected for sampling error.
Multivariate analyses: risk-factors for mental health and psychiatric needs in low-density departments.
| Mental health need | Psychiatric need | |||
|---|---|---|---|---|
| Predictor | OR | (95% CI) | OR | (95% CI) |
| Type of housing | ||||
| Home-owner | 1.00 | ** | 1.00 | ** |
| Government sponsored housing | 1.48 | (1.29-1.71) | 1.77 | (1.40-2.25) |
| Private renter | 1.22 | (1.07-1.38) | 1.49 | (1.23-1.80) |
| Other | 1.03 | (0.82-1.29) | 1.44 | (1.02-2.05) |
| Age in groups | ||||
| 18-24 | 1.00 | ** | ||
| 25-39 | 1.05 | (0.87-1.27) | ||
| 40-54 | 1.19 | (0.98-1.43) | ||
| 55-64 | 1.05 | (0.85-1.30) | ||
| 65-79 | 0.97 | (0.76-1.22) | ||
| ≥80 | 0.95 | (0.70-1.28) | ||
| Employment Activity | ||||
| Unemployed | 1.00 | ** | ||
| Employed | 0.64 | (0.55-0.74) | ||
| Retired | 0.58 | (0.49-0.70) | ||
| Households with | ||||
| 1 adult | 1.00 | ** | ||
| ≥2 adults | 0.41 | (0.34-0.51) | ||
| Government housing support | 1.45 | (1.17-1.81) | ||
| Total number of persons per household (per person) | 1.10 | (1.02-1.19) | ||
Risk-factors for mental health and psychiatric needs are reported for departments with a density ≥200 habitants/km². * All models are adjusted for variables with significance (p<0.20) using a backward stepwise process of selection: mental health needs adjusted for type of housing, age in groups, and employment activity; psychiatric needs adjusted for type of housing, number of adults per household, total number of persons in household, and persons with governmental housing support. ** p-values calculated using Wald test in a multivariable logistic regression model accounting for weighted survey data.
Multivariate analysis: risk-factors for mental health and psychiatric needs in high-density departments.
| High Density Department | ||||
|---|---|---|---|---|
| Mental health need | Psychiatric need | |||
| Predictor | OR | (95% CI) | OR | (95% CI) |
| Type of housing | ||||
| Home-owner | 1.00 | ** | 1.00 | ** |
| Government sponsored housing | 1.49 | (1.24-1.77) | 2.54 | (1.94-3.33) |
| Private renter | 1.55 | (1.32-1.82) | 2.05 | (1.55-2.69) |
| Other | 1.31 | (0.97-1.76) | 2.62 | (1.70-4.03) |
| Households with | ||||
| 1 adult | 1.00 | ** | 1.00 | ** |
| ≥2 adults | 0.81 | (0.67-0.99) | 0.74 | (0.56-0.97) |
| Marital or partnership status | 0.65 | (0.54-0.77) | 0.60 | (0.45-0.78) |
| Total number of persons per household (per person) | 1.06 | (1.00-1.13) | ||
| Duration of habitation | ||||
| ≤5 years | 1.00 | ** | ||
| >5 years | 1.11 | (0.86-1.43) | ||
Risk-factors for mental health and psychiatric needs are reported for departments with a density >200 habitants/km².
* All models are adjusted for variables with significance (p<0.20) using a backward stepwise process of selection: mental health needs adjusted for type of housing, number of adults per household, married or partnership status, total number of persons in household; psychiatric needs adjusted for type of housing, number of adults per household, married or partnership status, and time of household occupation.
** p-values calculated using Wald test in a multivariable logistic regression model accounting for weighted survey data.
Predicted percentage of persons with MHN is found in Fig. (1a) in LD and Fig. (2a) in HD departments. The difference between observed and expected predictions ranged from -2.8% to +5.1% for LD and -2.3% to +3.8% in HD departments. Despite similar ranges, the average residual was 1.4 times higher in low- vs. HD departments (avg residual=5.3x10⁻⁴ and 3.7x10⁻⁴, respectively), suggesting weaker accuracy in LD departments.
Predicted percentage of persons with PN is found in Fig. (1b) and (2b) in low- and HD departments, respectively. For LD departments, predictions ranged from -4.2% to +2.3% off the observed value, while these values ranged from -2.3% to +2.5% for high- density departments. Similar to mental health needs, LD departments had average residuals that were 1.7 times higher than HD departments (avg residual=3.0x10⁻⁴ and 1.8x10⁻⁴, respectively).
Predictions of MHN, based on INSEE data are also found in Fig. (1a) for LD and Fig. (2a) for HD departments. Prediction estimates differed by -5.3% to +3.2% for LD and -3.2% to +3.2% for HD departments. Prediction estimates differed by -5.3% to +3.2% for LD and -3.2% to +3.2% for HD departments from the observed values, with the majority of predictions as underestimations (10/13 in low- and 8/9 in HD predictions). Residuals were also 1.5 times higher in low- vs. HD departments (8.5 x10 and 5.5 x10, respectively).
Predictions of PN based on INSEE data are represented in Figs. (1b and 2b) for low- and HD departments, respectively. The difference between observed and expected estimates ranged from -5.2% to +0.9% for LD and -3.9% to +0.6% for HD departments, as predictions were mostly under the observed values (8/13 in low- and 8/9 in
high-density). For both MHN and PN, accuracy was substantially higher in HD (avg residual=0.2 x10⁻⁴) when compared to LD departments (avg residual= 4.5 x10⁻⁴).
DISCUSSION
Using a population based-survey, we confirmed the correlation between Socio-Demographic variables, more specifically marital and employment status with MHN and PN [30]. Unfortunately, transforming Socio-Demographic variables into an operational method, according to which resources are distributed at a regional level, is not an easy task to accomplish. Considering the survey sample size, the results of the present paper are somewhat disappointing.
Indeed, there are some drawbacks when using results from population surveys to determine needs for mental- health services. Firstly, estimated prevalence for mental disorders is open to bias due, inter alia, to incomplete participation and to the reliability of self-declarative data. Secondly, the survey sampling design may skew prevalence of MHN. For example, people with very low socioeconomic status might not have a fixed address or mobile or telephone number. They are usually most vulnerable to many severe mental health problems and in need of greatest mental-health care, but since they could have been unreachable via telephone survey, this population could have been inadvertently excluded from the sample population. Therefore, the prevalence of MHN predicted from the model may not represent the “true” need. It should also be noted that the distance between predicted and observed values does not necessarily invalidate the use of social indicators, as some of the model variation could be explained by study design.
Overall, predictability of needs using Socio-Demographic data were more likely to be accurate for HD than LD departments. This finding, which correlates with other studies, [12, 13, 31] could be due many different factors. In a study conducted by Burgess et al. [28] they suggested that this discrepancy could be due to factors immeasurable from social indicators in population survey. Factors
such as differences in hospital policies, negative attitude towards mental illness and psychiatric treatment, lack of anonymity while seeking mental health care and difficulty in accessibility (including longer distance to) and availability of services could hinder rural residents from seeking mental health care [31]. Hence, the variability of people in rural areas seeking help could be more influenced and less predictable than those in urban areas.
Of the six social indicators examined in this study, only housing type, especially government sponsored housing, yielded a higher OR for PN, both in urban and rural areas. For the remaining social deprivation and fragmentation indicators, there was no distinction between predictability of the two types of needs. One possible explanation for this finding is that housing type (and ownership) can be a proxy for socioeconomic and employment status. In urban areas, where the housing price is high, people living in government-sponsored houses are probably either socioeconomically deprived or unemployed, both of which are strong indicators for elevated needs of mental and psychiatric care [8]. However, unlike urban areas, housing could be cheaper and home ownership does not necessarily correspond to employment status in LD departments. Usually in these departments, a large per cent of the population is older and retired, which correlates with lower prevalence of mental health needs when compared to younger and unemployed populations.
In order to consider Socio-demographic variables as an acceptable approach for planning healthcare resources in HD departments, an additional step is needed before the method proposed herein can be fully implemented. In the present study, we used the department (“department”), a historically administrative geographical unit with a population size that ranges from 200 000 to over one million individuals. This choice was justified by the abundant resources of publicly available demographic data at the department-level, which includes data on mental-health resources, such as the number of psychiatrists, general practitioners and psychiatric hospital beds, and information on social benefit expenditure.
However, departments vary greatly in population size and structure and do not necessarily reflect the current socioeconomic composition of the whole region, yielding the option of extrapolating to bigger geographical region highly constrained. In this survey, however, postal area codes were available, thus allowing more refined territorial definitions, including another territorial unit already in use for more flexible health-care planning. In fact, National Health Ministry guidelines have recommended using smaller units of around 200,000 inhabitants for planning mental healthcare resource allocation [32]. A thorough understanding of the region and careful division of the territorial unit would be crucial for planning of mental health care resources.
One of the limitations of this study is the cut-off between psychiatric versus mental health needs. The different needs were mainly derived from either the Sheehan disability scale by using recommended cut-offs [27] or a strict definition of co-morbidity as a severe event, which usually corresponds to a higher probability of healthcare use [33]. Second, we used post-stratification weighting in order to represent the entire French population and not individual departments. This could have affected variance estimates of our models and hence reduced prediction accuracy.
Furthermore, our modelling strategy was somewhat atypical – constructing a predictive model with epidemiological data and then applying it to census data with missing information on mental health needs. Indeed, a cross-validation approach or “internal validation” could have been helpful in this context, whereby a randomly-selected subset of the data is used to construct the initial model and other randomly-selected subsets thereafter are used to validate the model. “External validation”, in which our model is applied to another epidemiological database containing the same parameters, would have also been immensely helpful, yet unfortunately; there were no databases of this kind at our disposition. Finally, there are a number of more technical models that could help refine predictive capacity. For instance, “boosting” algorithms can create a series of sub-datasets aimed to reduce model error, especially for observations that are difficult to predict [34]. Future research should aim to validate our findings and to predict mental health needs with more complex models, while keeping in mind the profound differences observed between high- and low-density regions.
In this study, we have constructed a model that can be used for allocation of mental health resource by predicting MHN from various social indicators generated in population survey. This model yields high predictability of MHN in HD departments. However, this does not always reflect the actual usage of the mental health resources [5]. In addition, even if more resources are available, this does not always result in increased use of the service by people with mental disorders [35]. Social characteristics such as age, gender, educational level and social network, and other immeasurable variables, such as genetic and biological differences can influence the intentions and actions of seeking mental health care At best, we can correlate certain social indicators predict needs of mental health care resources at a local level but, we need social infrastructures and programs to encourage actual utilization of those resource. In retrospect, collecting and incorporating information on current usage of any form of mental health care service, whether public or private, could have been helpful in differentiating between a need for a better quality versus more mental health care. This need is different from primary or secondary mental health care needs and would be critical in addressing mental health care needs and allocating resources appropriately.
CONCLUSION
Socio-demographic indicators routinely produced by national statistics centers may be useful for predicting mental health and psychiatric needs in local territories, such as the French departments with higher population density. However, such indicators should not be used on their own. Other predictors, including hospitalization data and local expert opinions from patients and family members through delta group or similar techniques [36], maybe more useful when used together with demographic predictors. Both predictions and observational data indicate that healthcare needs greatly vary between local territorial units, thereby justifying the need to identify indicators that could be used to plan the distribution of mental health resources. The ideal territorial size to be considered when planning psychiatric and mental health resource still needs to be identified, taking into account data availability, heterogeneity of the population, and the administrative level at which resource allocation is decided.
CLINICAL IMPLICATIONS
Given the shortage of resources, it is essential to distribute healthcare funds according to specific needs and to identify individuals likely to receive costly interventions.
Using an epidemiological survey, a set of common social indicators were employed to predict mental health, which could help health authorities plan and orient diverse levels of needs.
LIMITATIONS
Although the size of the survey was large (20 000 persons), departments with small sample sizes makes predictions for these regions difficult.
It is hard to define the appropriate regional size for mental health resource planning, while large internal discrepancies often exist within subunits of regions.
ABBREVIATIONS
| MHN | = Mental health needs |
| PN | = Psychiatric needs |
| NPHS | = National Canadian Population Health Surveys |
| LD | = Low density |
| HD | = High density |
| vs | = versus |
CONFLICT OF INTEREST
The authors confirm that this article content has no conflict of interest.
ACKNOWLEDGEMENTS AND FUNDING
This study was funded by the Direction Générale de la Santé (DGS) and Direction des Hôpitaux et de l’Organisation des Services (DHOS), the French Ministry of Health, and by the Lorraine, Rhone Alpes, Ile de France, Haute Normandie regional authorities (DRASS). Data was collected by Ipsos, France.
The studied have been approved by CNIL (Commission Nationale Information Liberté).